

Analytics
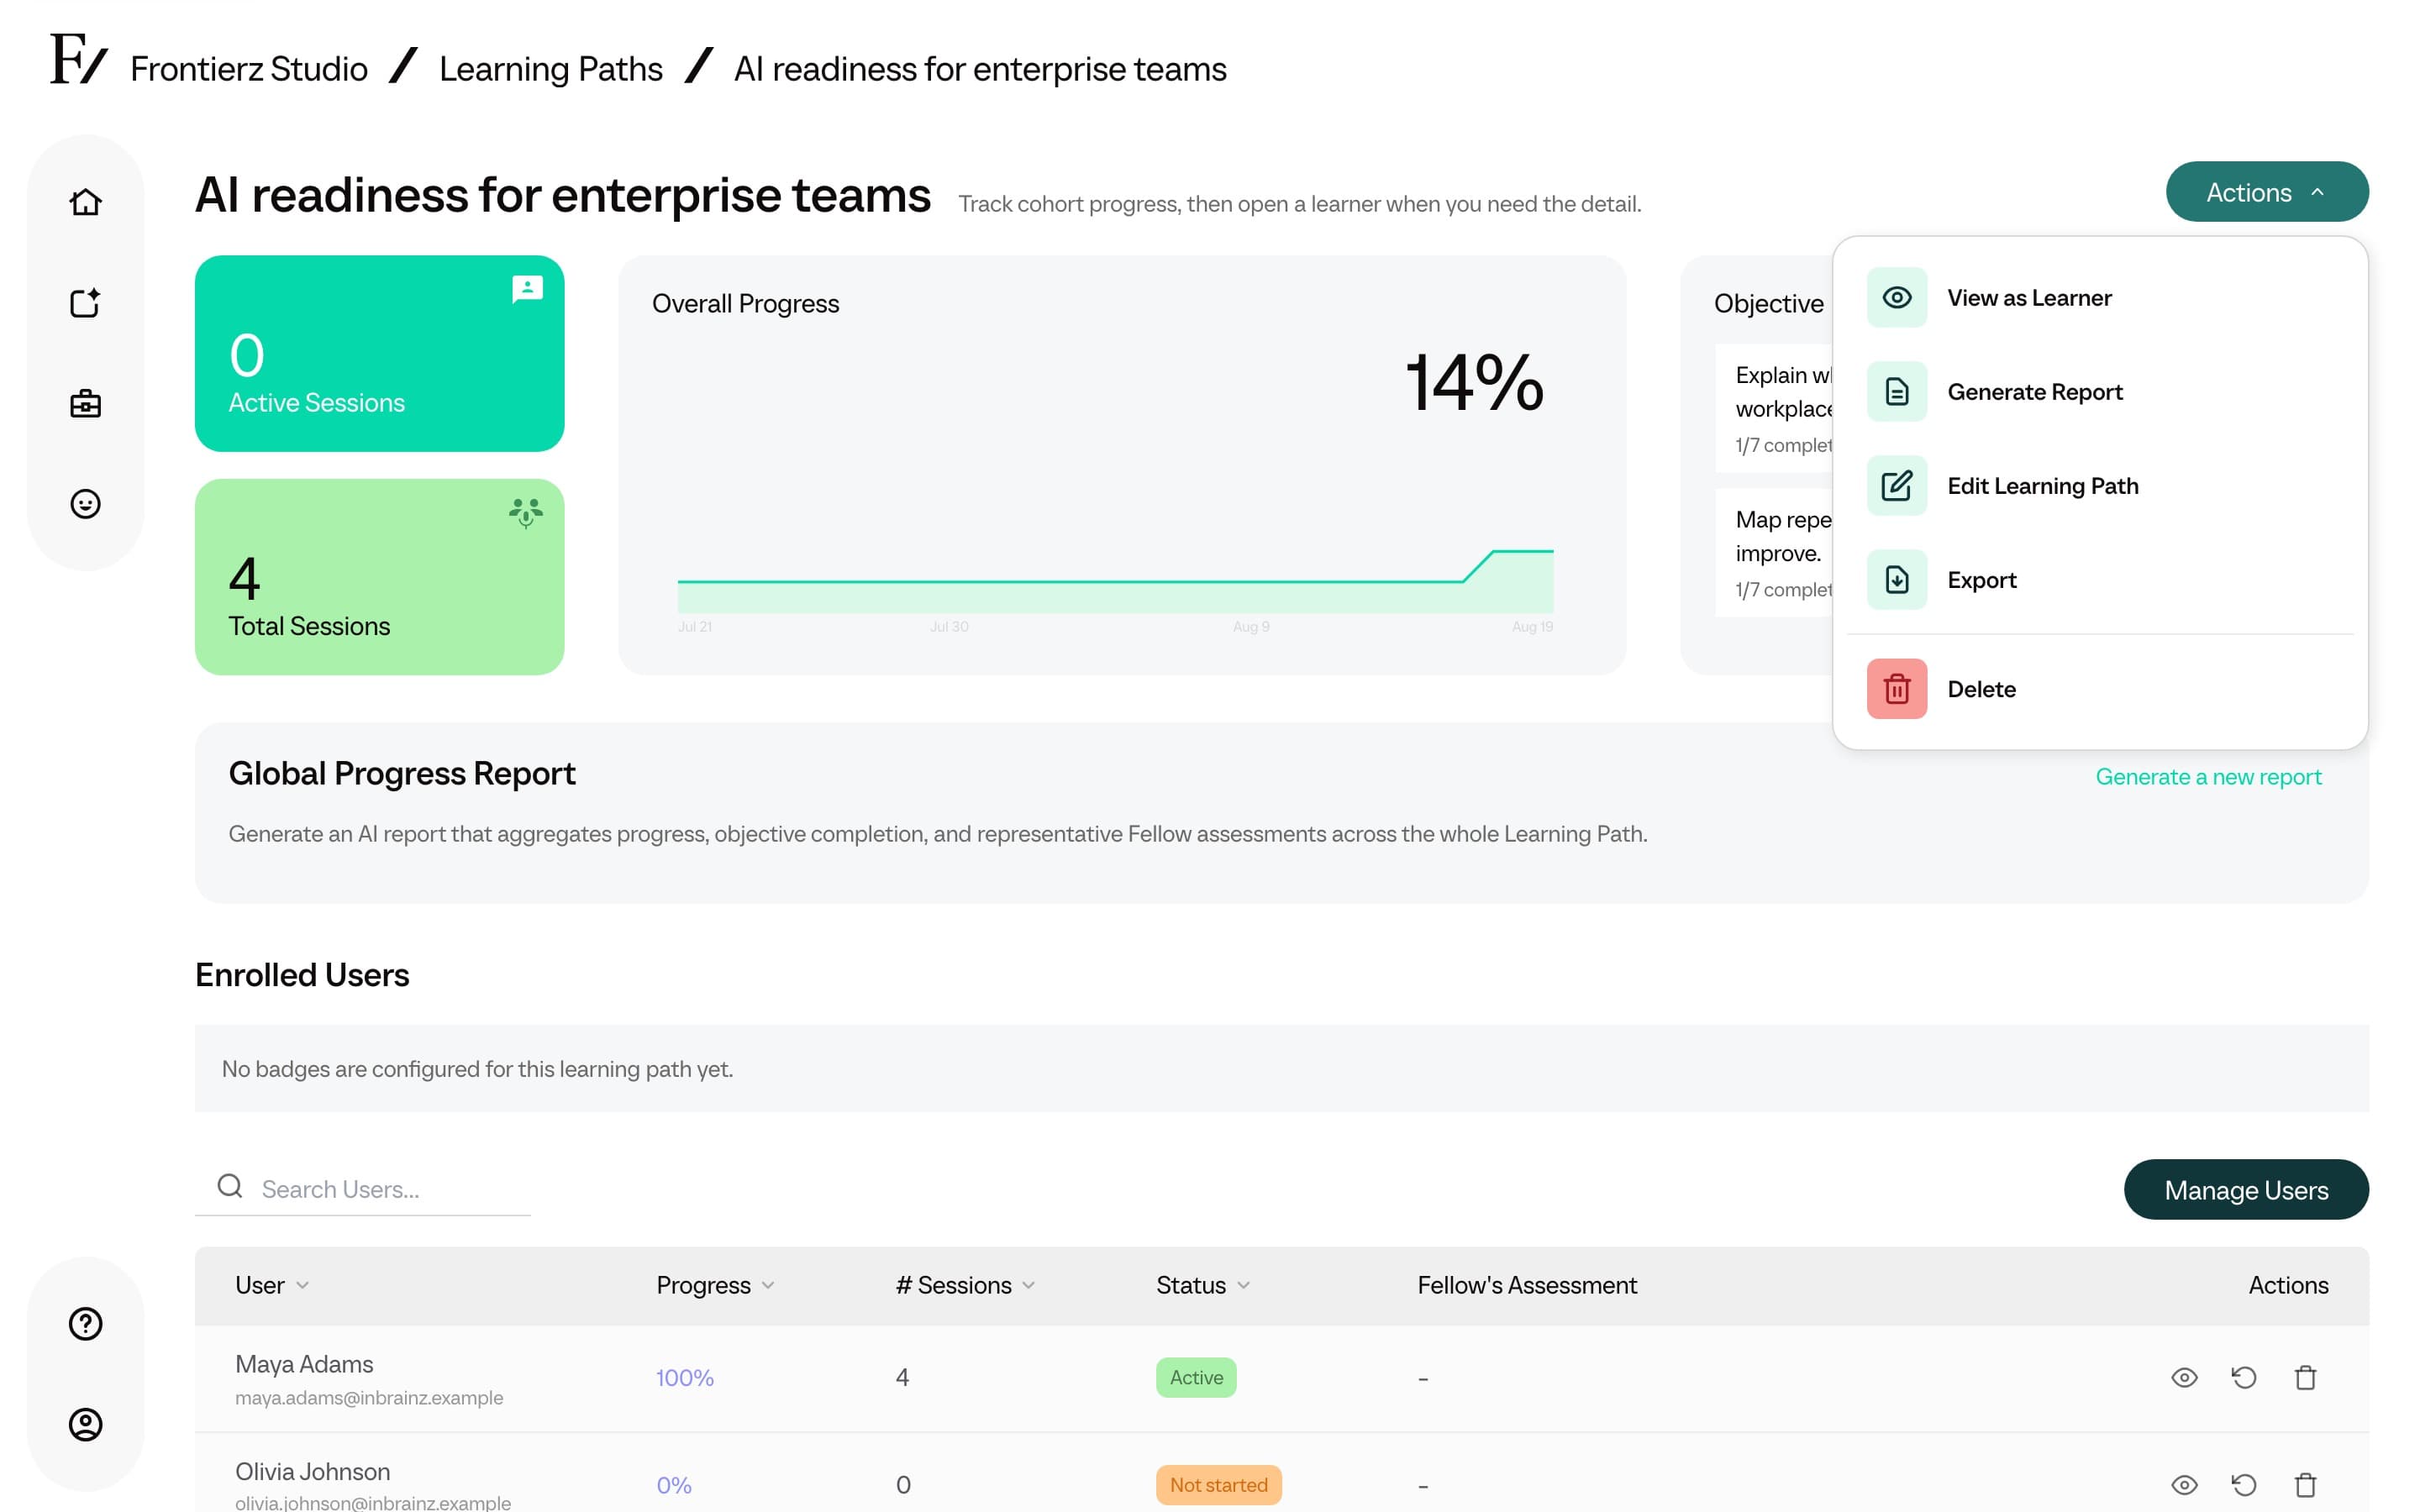
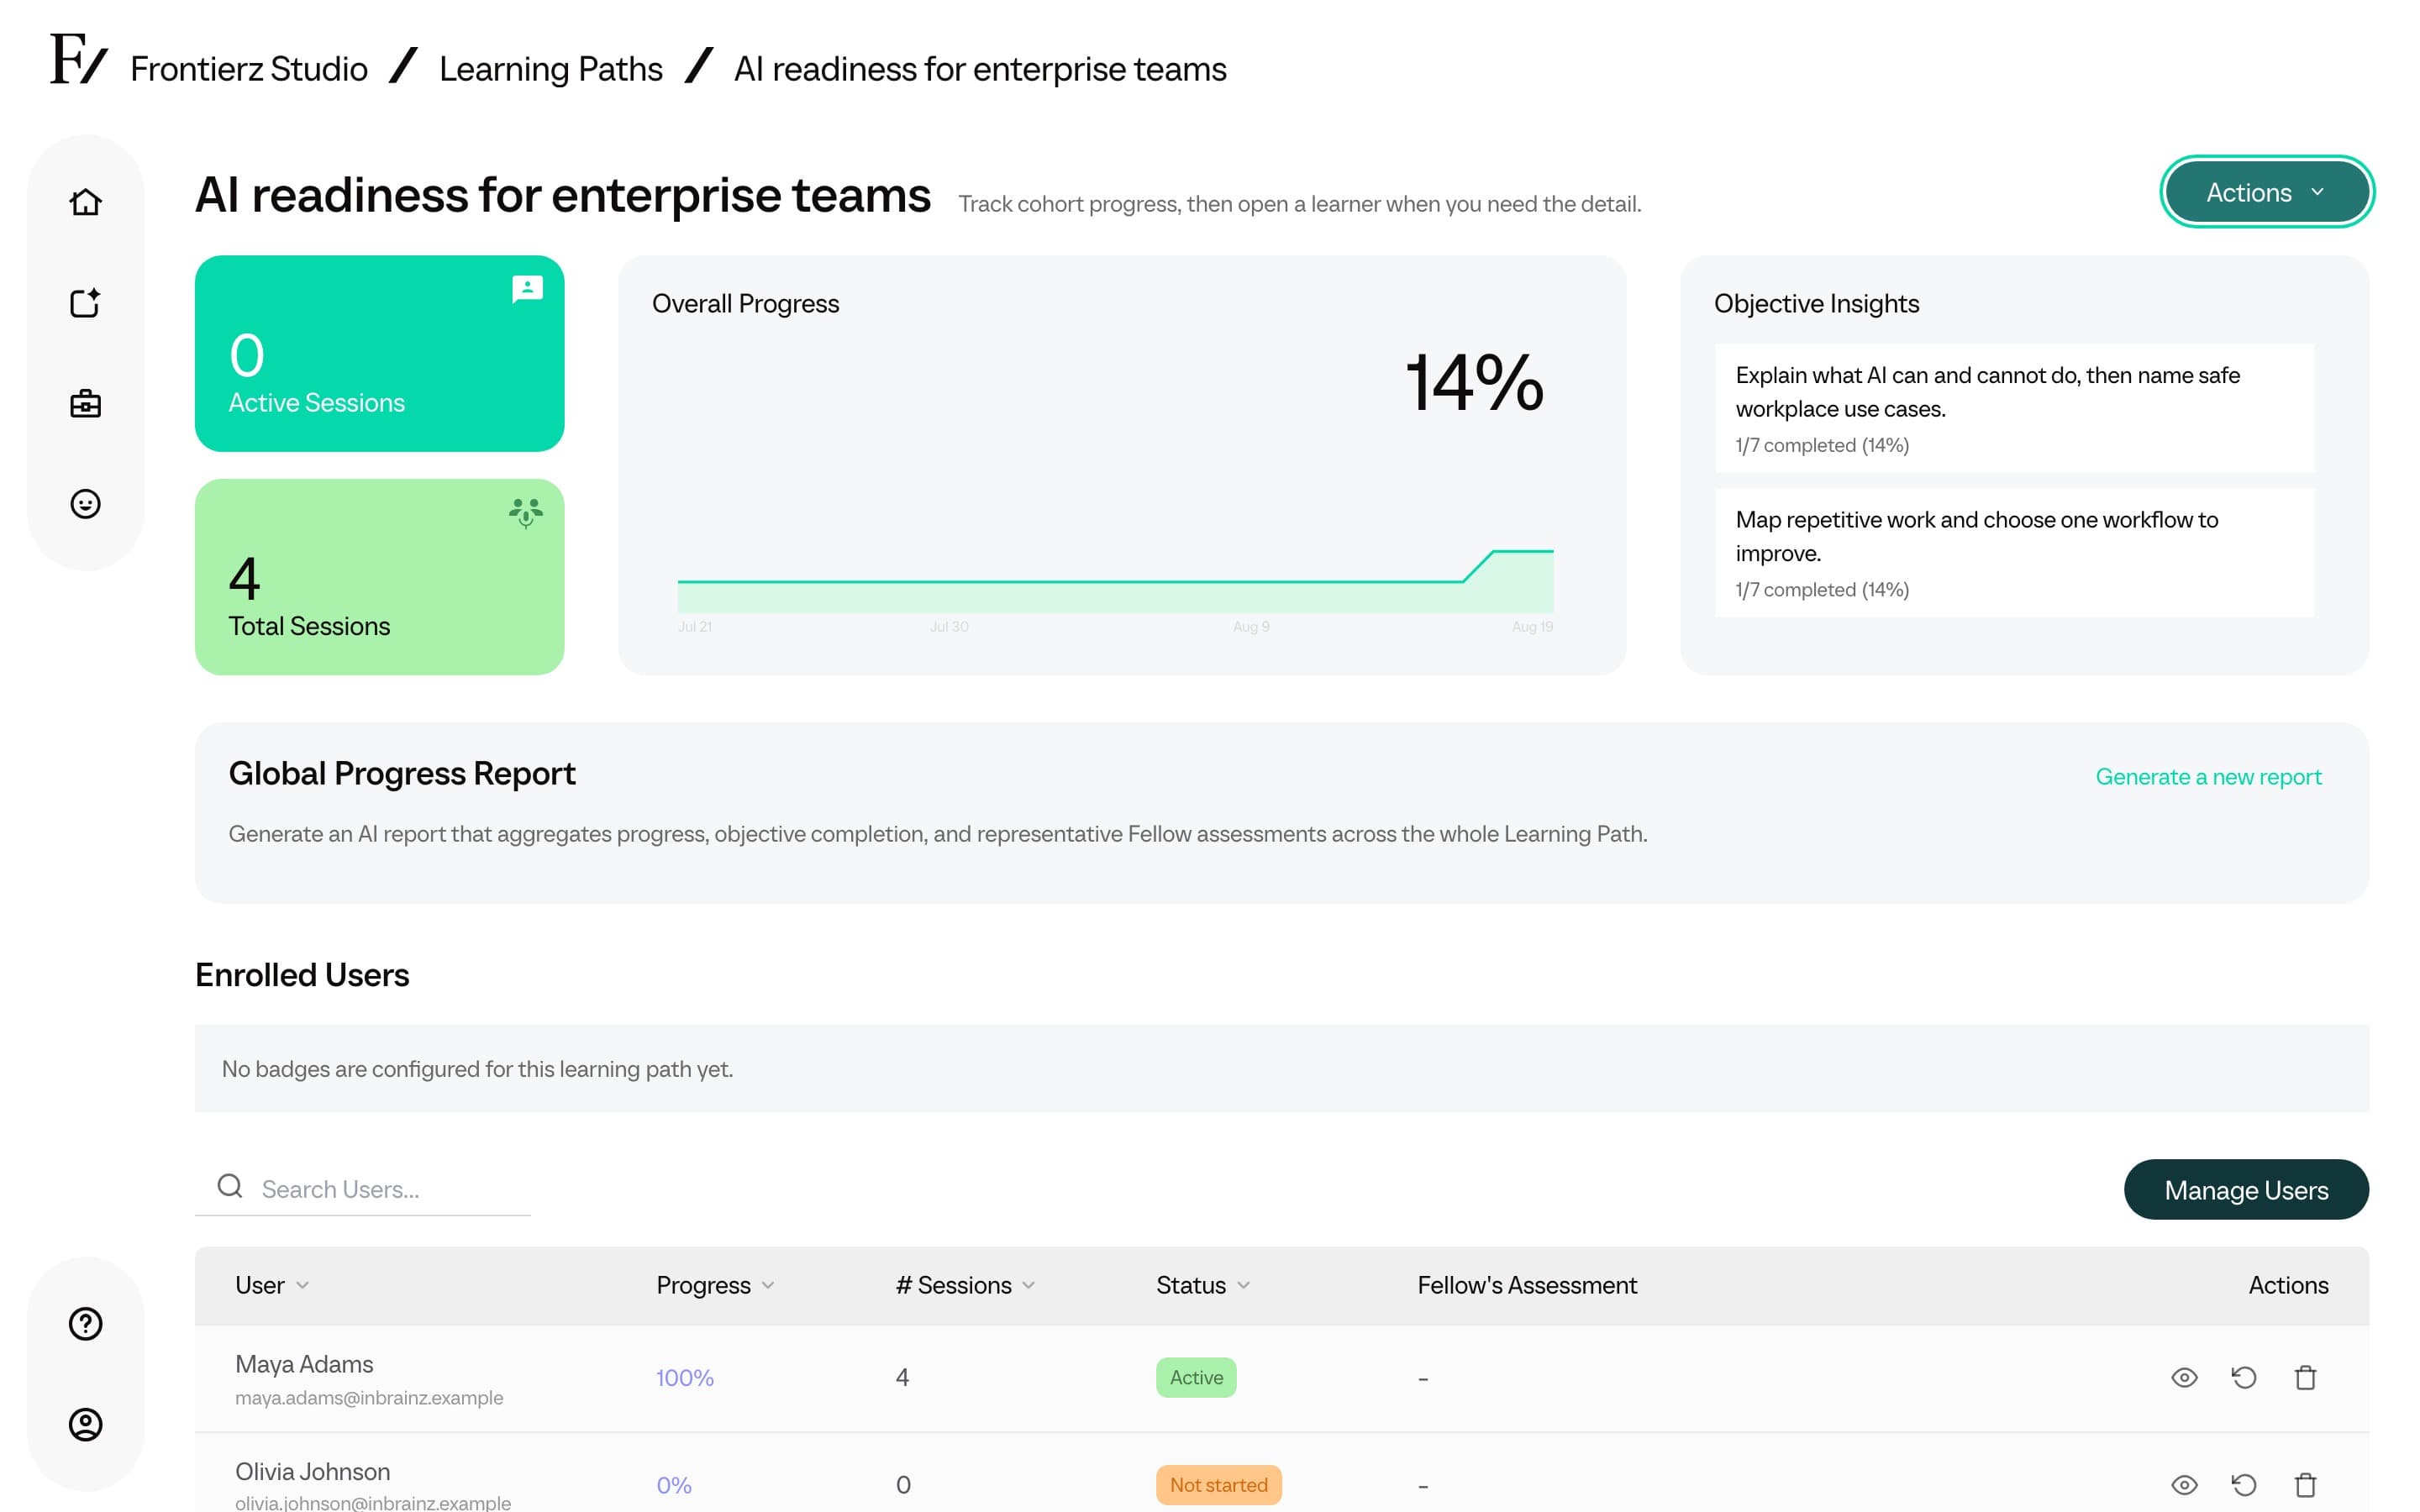
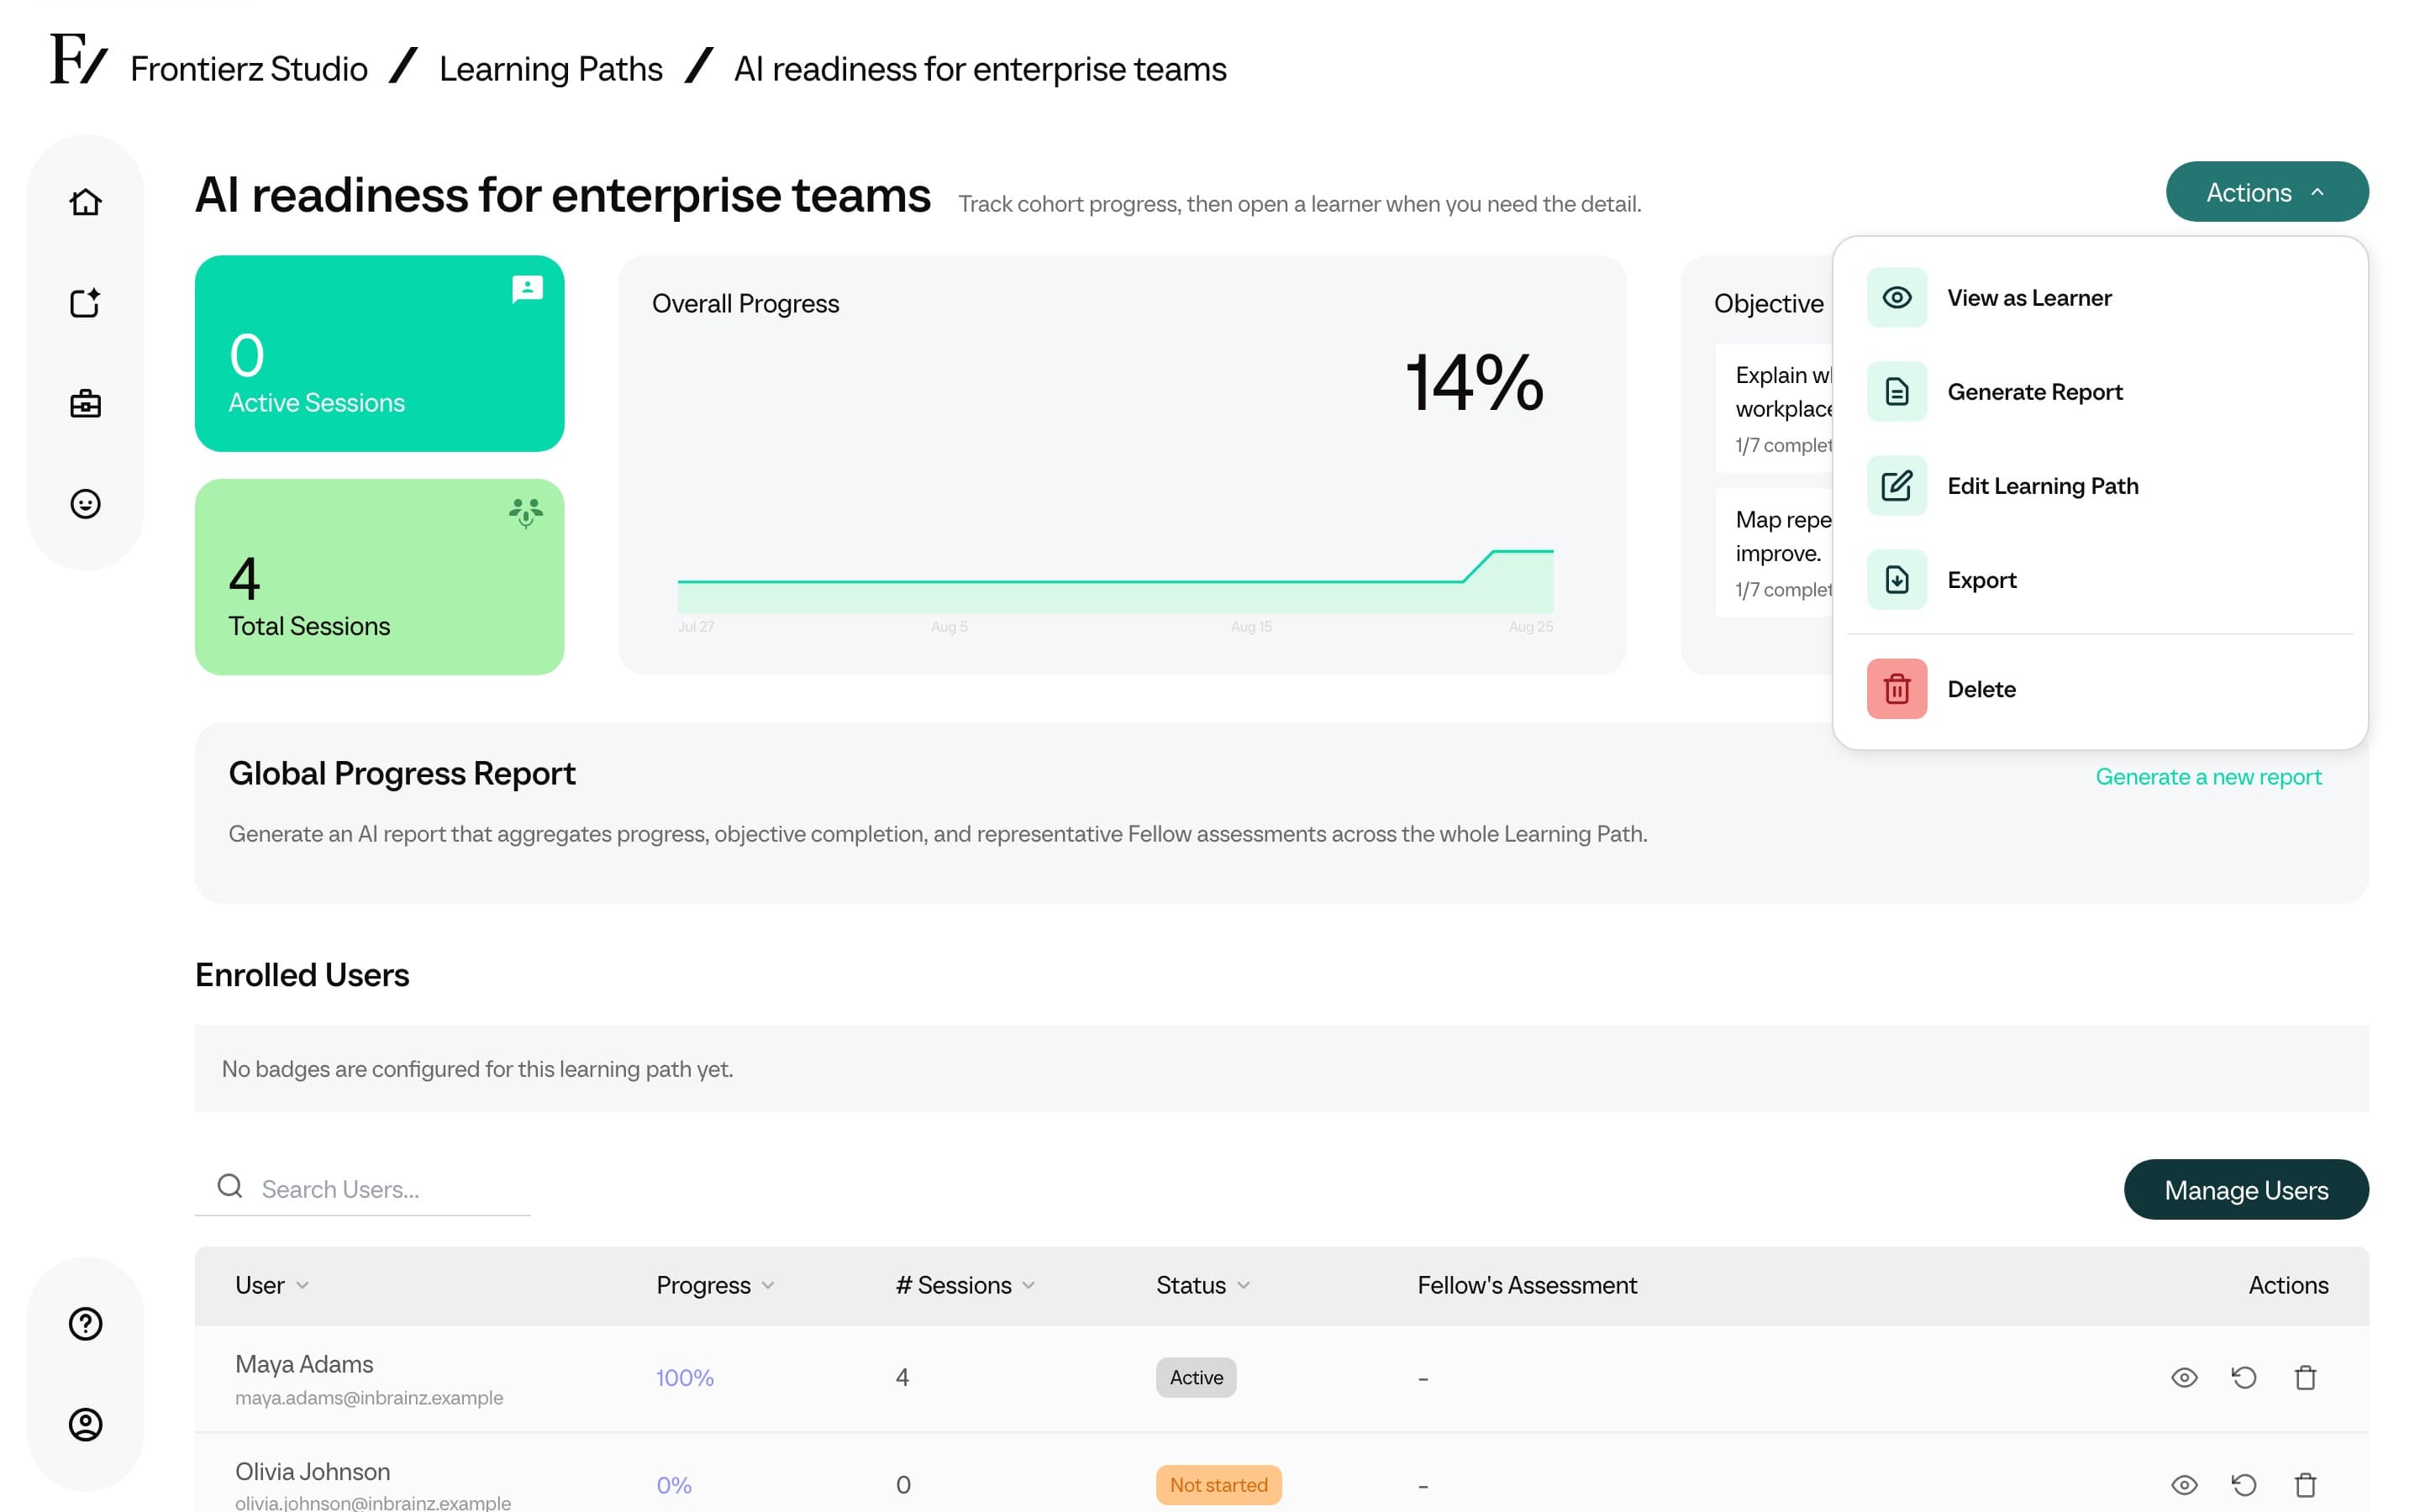
Each Learning Path includes a real-time analytics dashboard with the following metrics. The page title is the Learning Path name. Use Actions to view the path as a learner, generate a report, edit the path, export a Frontierz file, move the path to another tenant when that option is available, or delete the path.
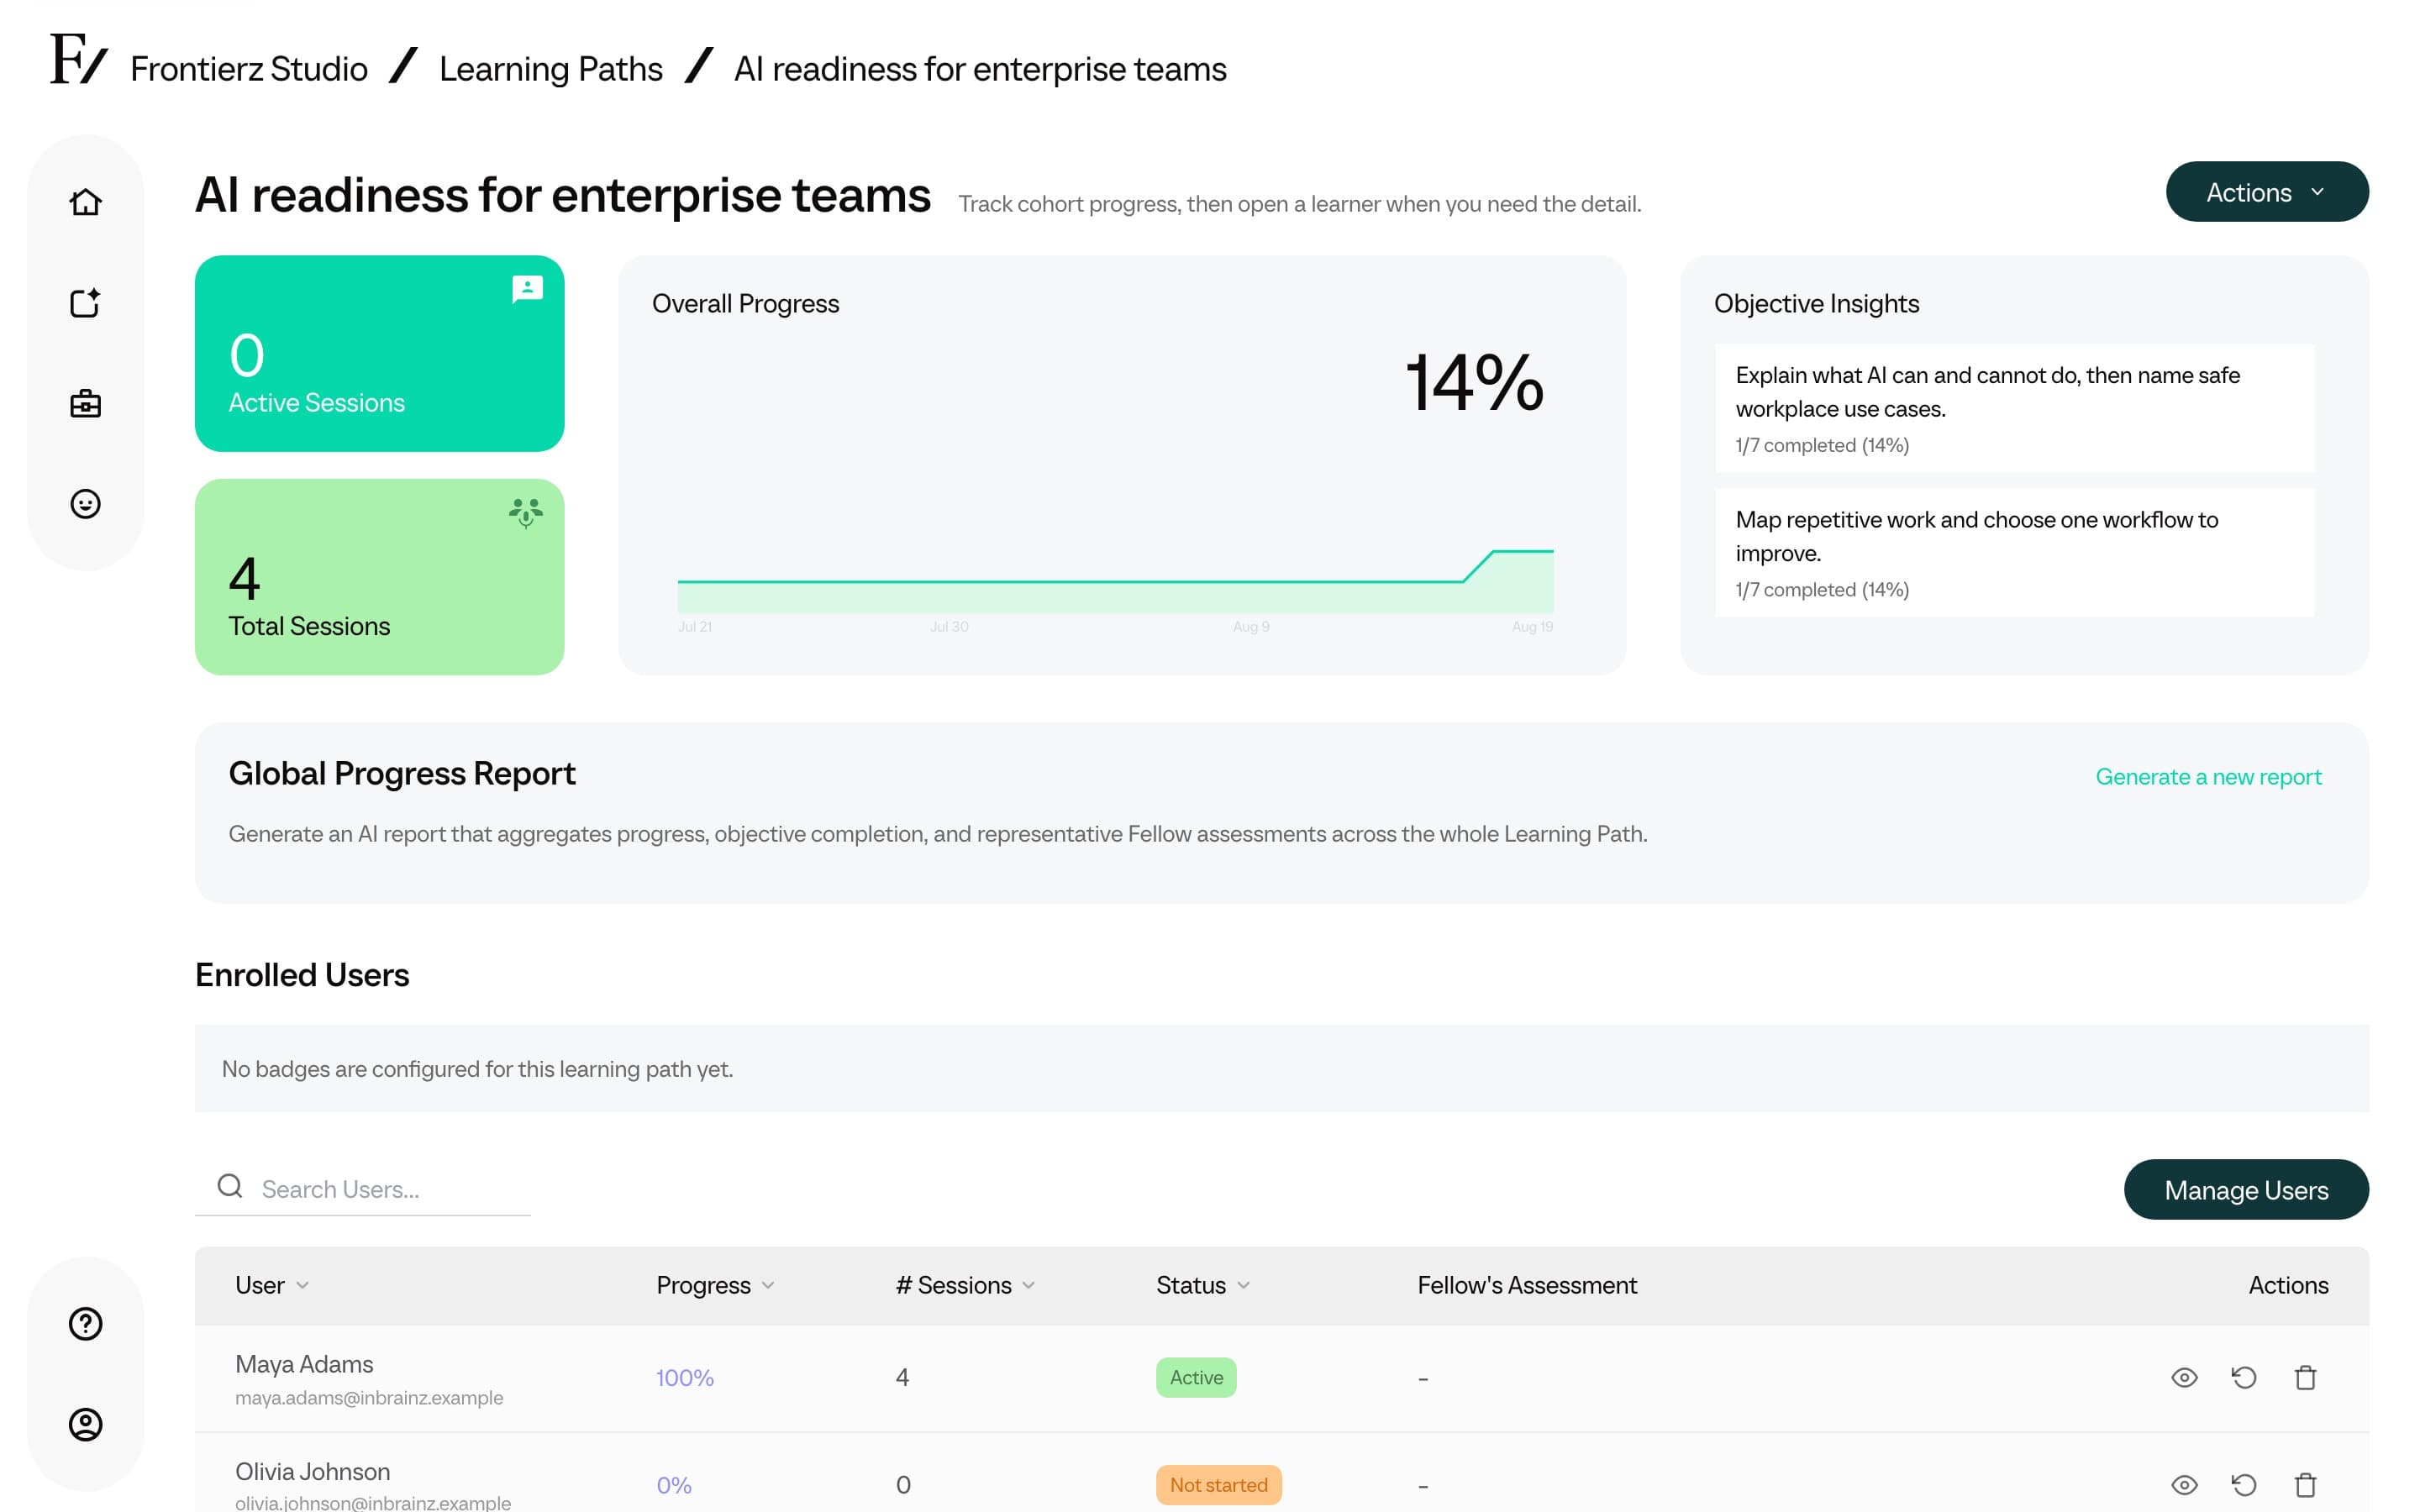
- Active and enrolled users with current count and trend.
- Per-session progress. The percentage of objectives each session has hit across the cohort.
- Conversation volume. Total conversations, messages, and voice minutes.
- Transcripts. Full text of every conversation, available for review.
- Overall progress. The adoption curve showing how the cohort is moving through the Learning Path.
- User insights. Structured data collected during sessions when the AI Fellow captures recurring fields.
The dashboard is updated continuously as users complete sessions. No batch processing delay applies.
Objective Insights
The Objective Insights card groups progress by objective, not only by session. For each objective, it shows how many assigned users completed it, the completion rate, and a short sample from recent Fellow assessments when evidence is available.
Use this card to spot the topics where users are clearing the objective and the topics where more coaching, clearer session notes, or a revised objective may be needed.
Enrolled Users
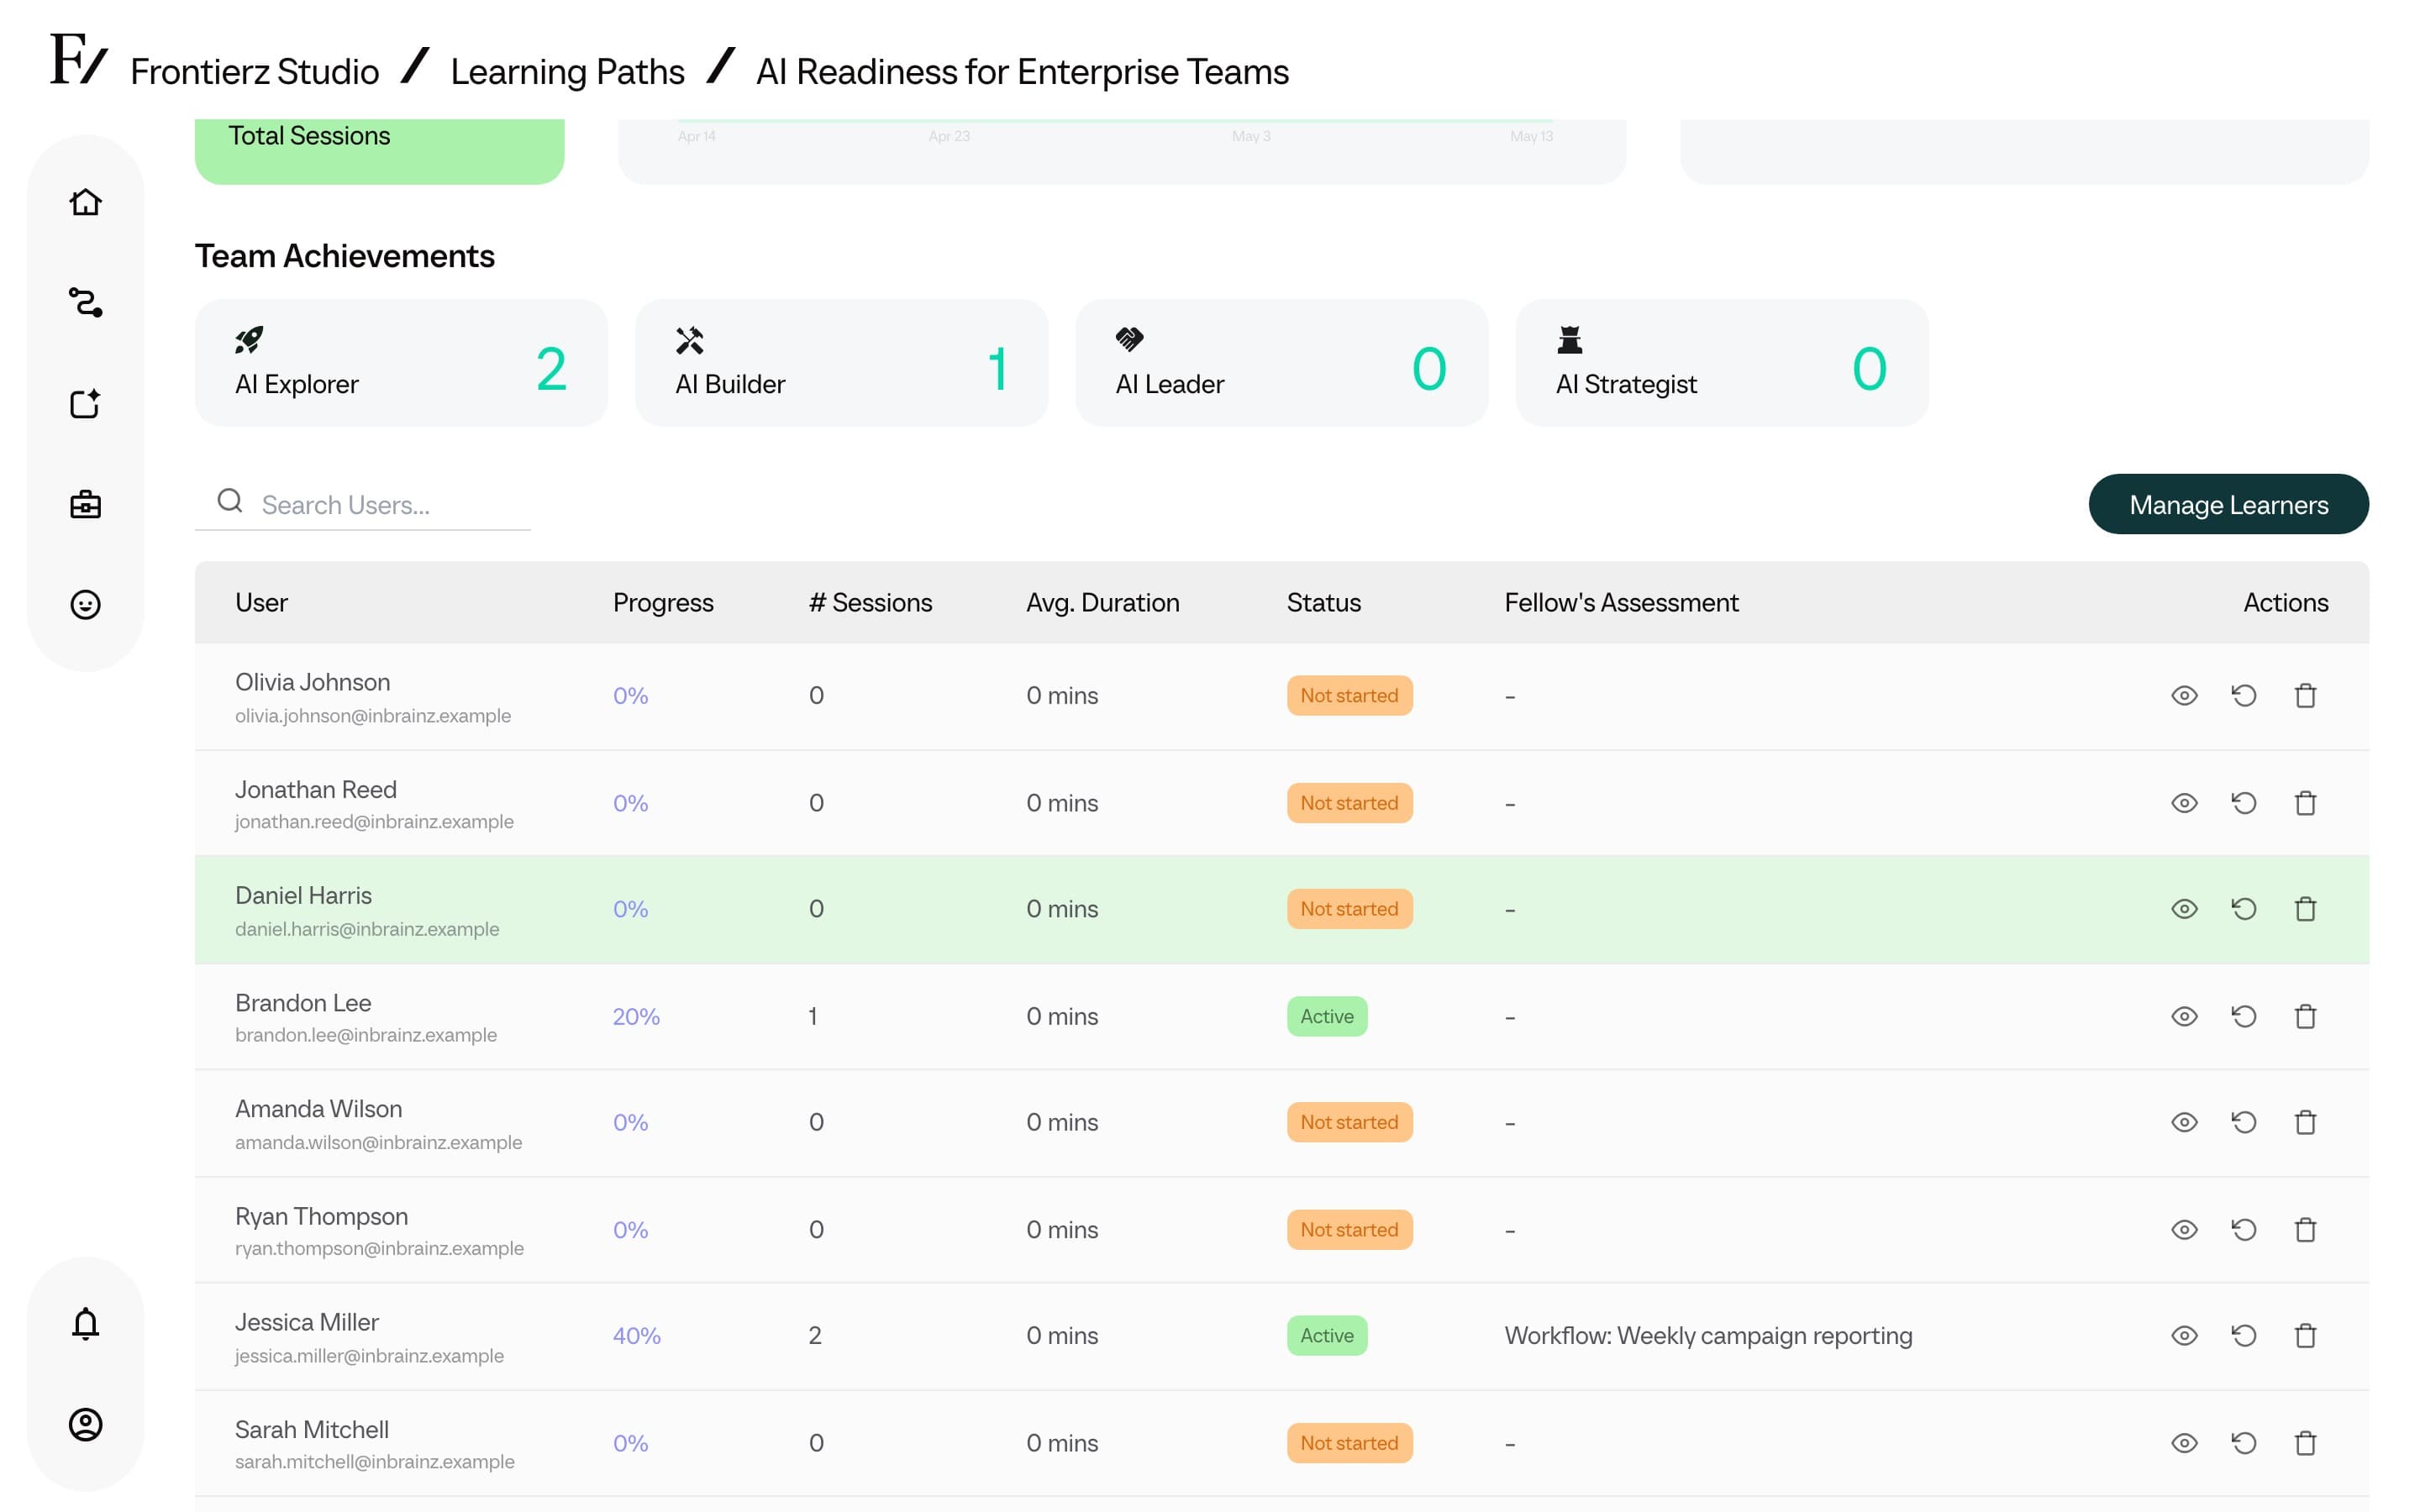
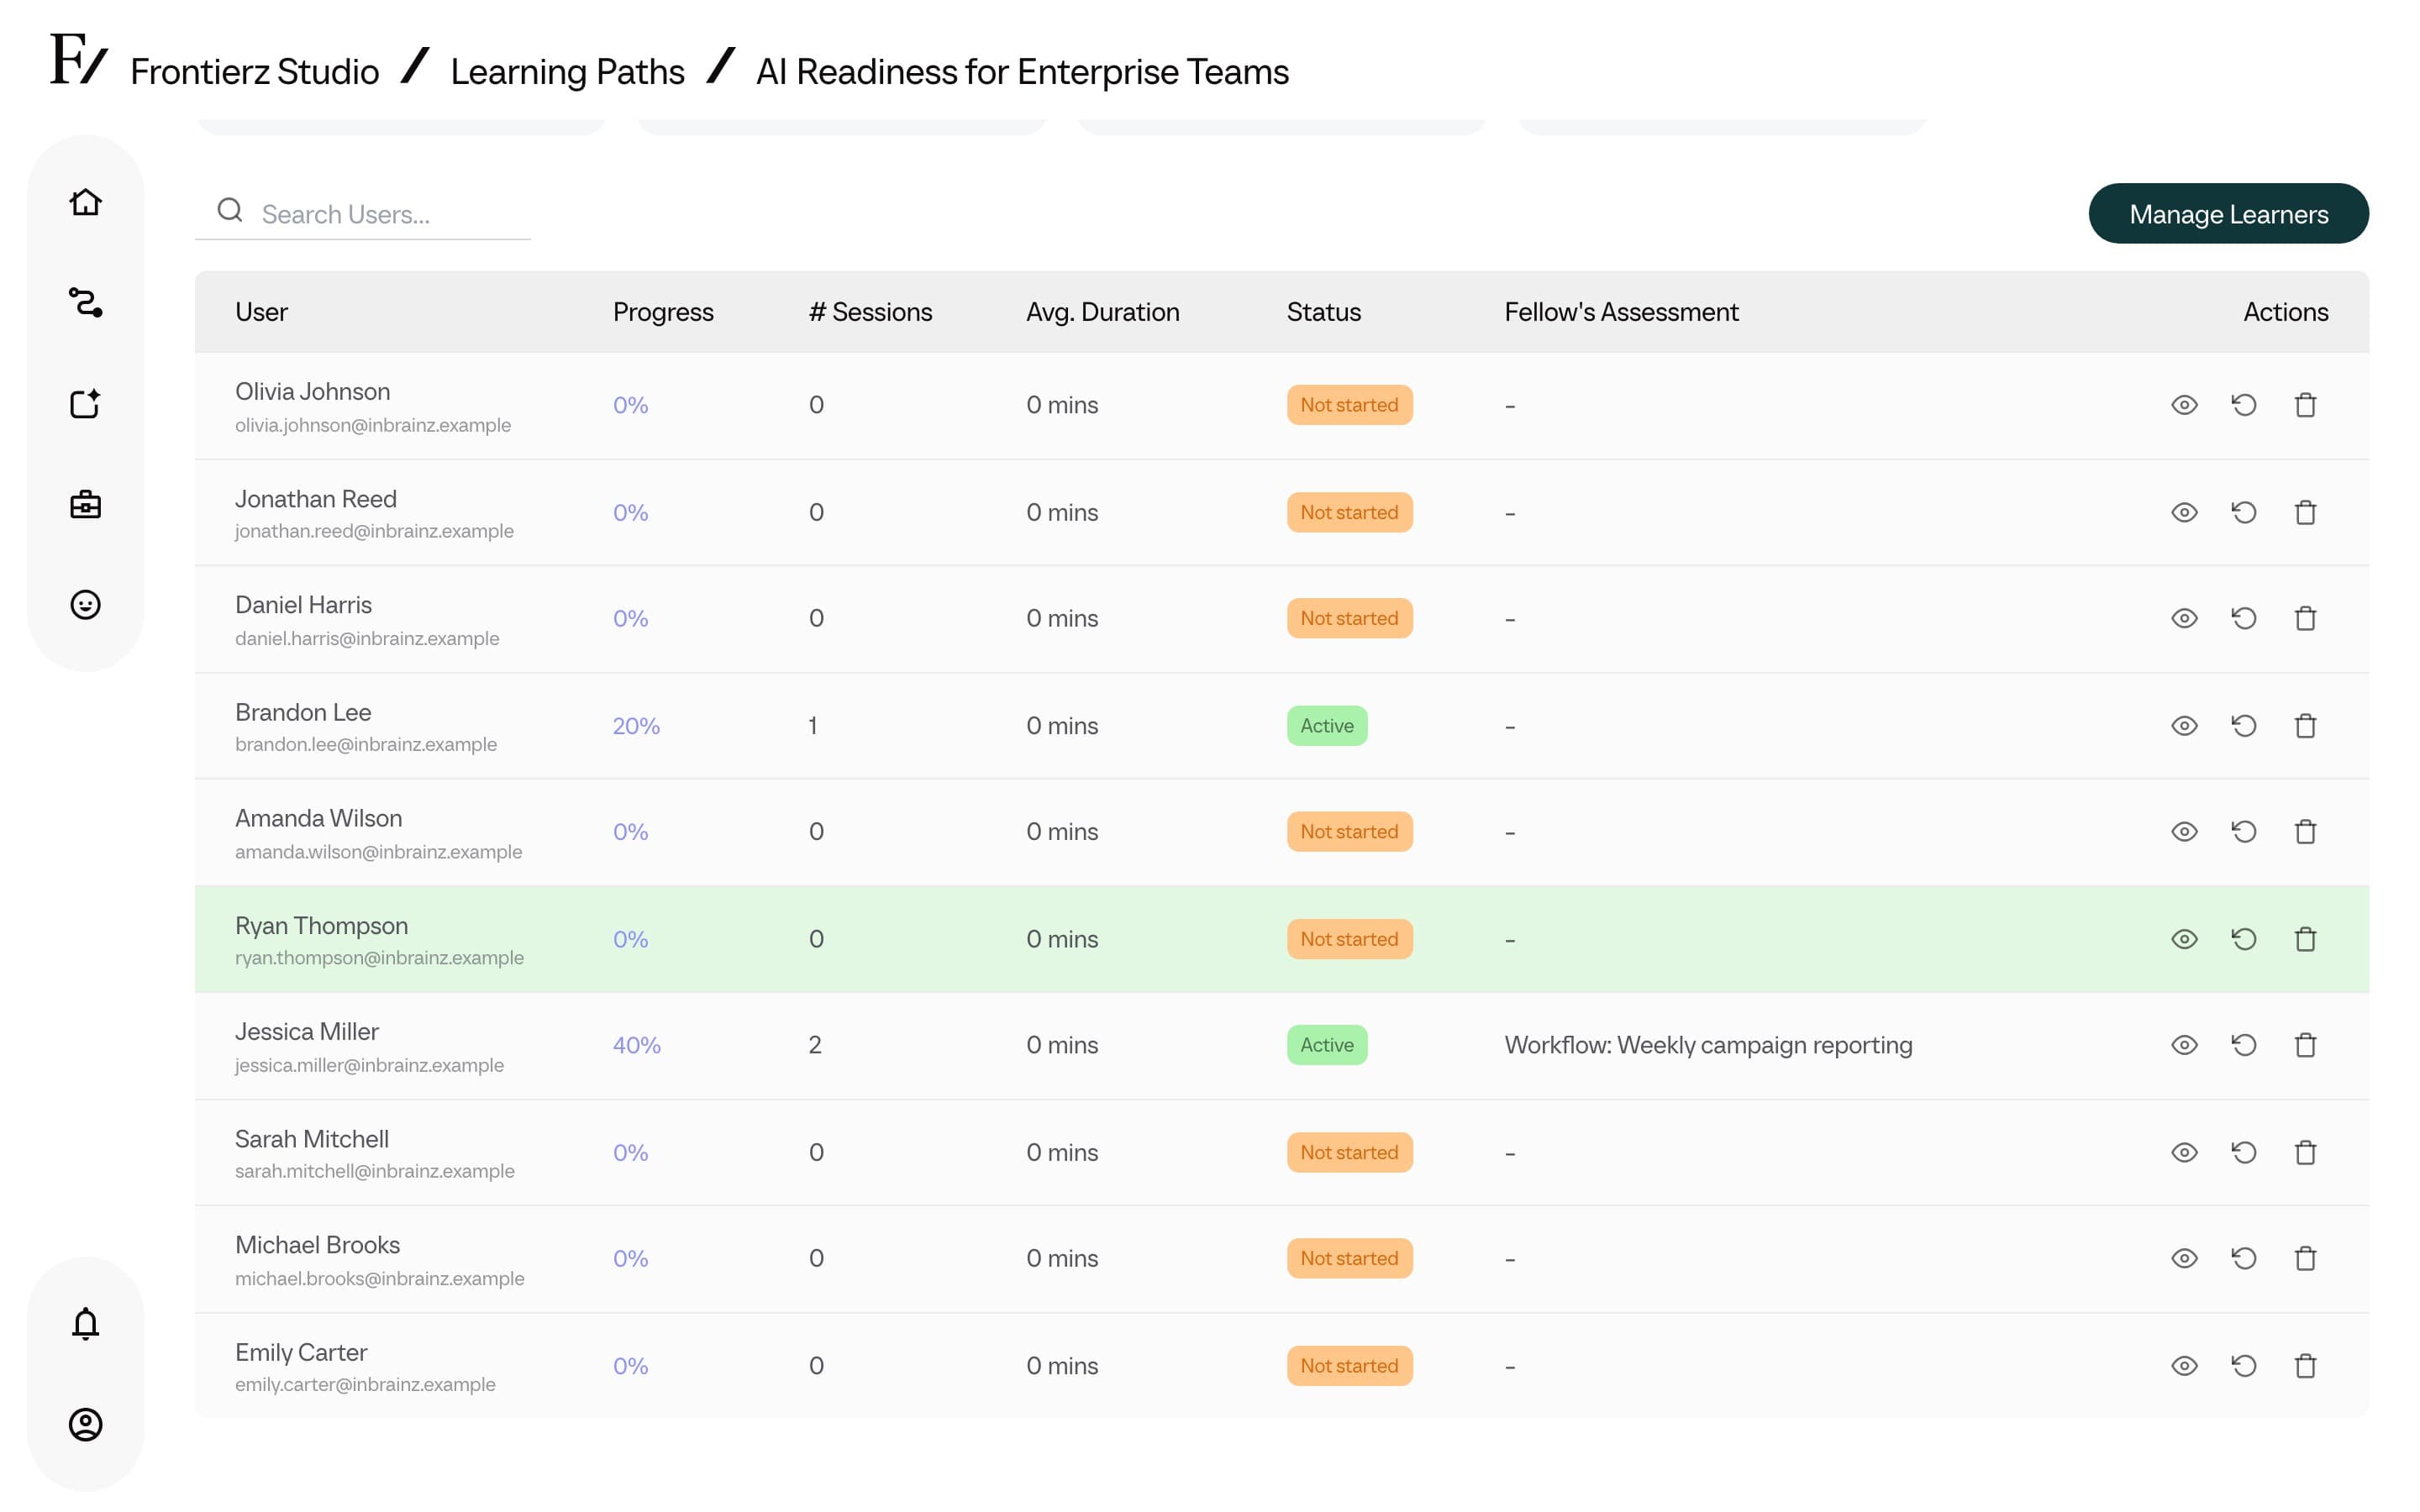
The Enrolled Users section shows session badge unlocks and the learner table. Use View as Learner at the top of the Actions menu to take the path yourself.
If you are not enrolled, that action opens a confirmation to enroll you first, then opens the learner view.
The badge cards group session badges by their selected icon and show how many users unlocked each badge. A custom session badge name is shown to learners on Your Journey. The dashboard uses the configured badge icon for its grouping and count.
These session badges are separate from Microsoft badges. Microsoft badges are external credentials shown on the Learning Path certificate page.
Global Progress Report
The Global Progress Report heading generates a written summary of the whole Learning Path, based on cohort progress, objective completion, session activity, and Fellow assessments. Use it for program reviews, internal updates, and planning what to do next.
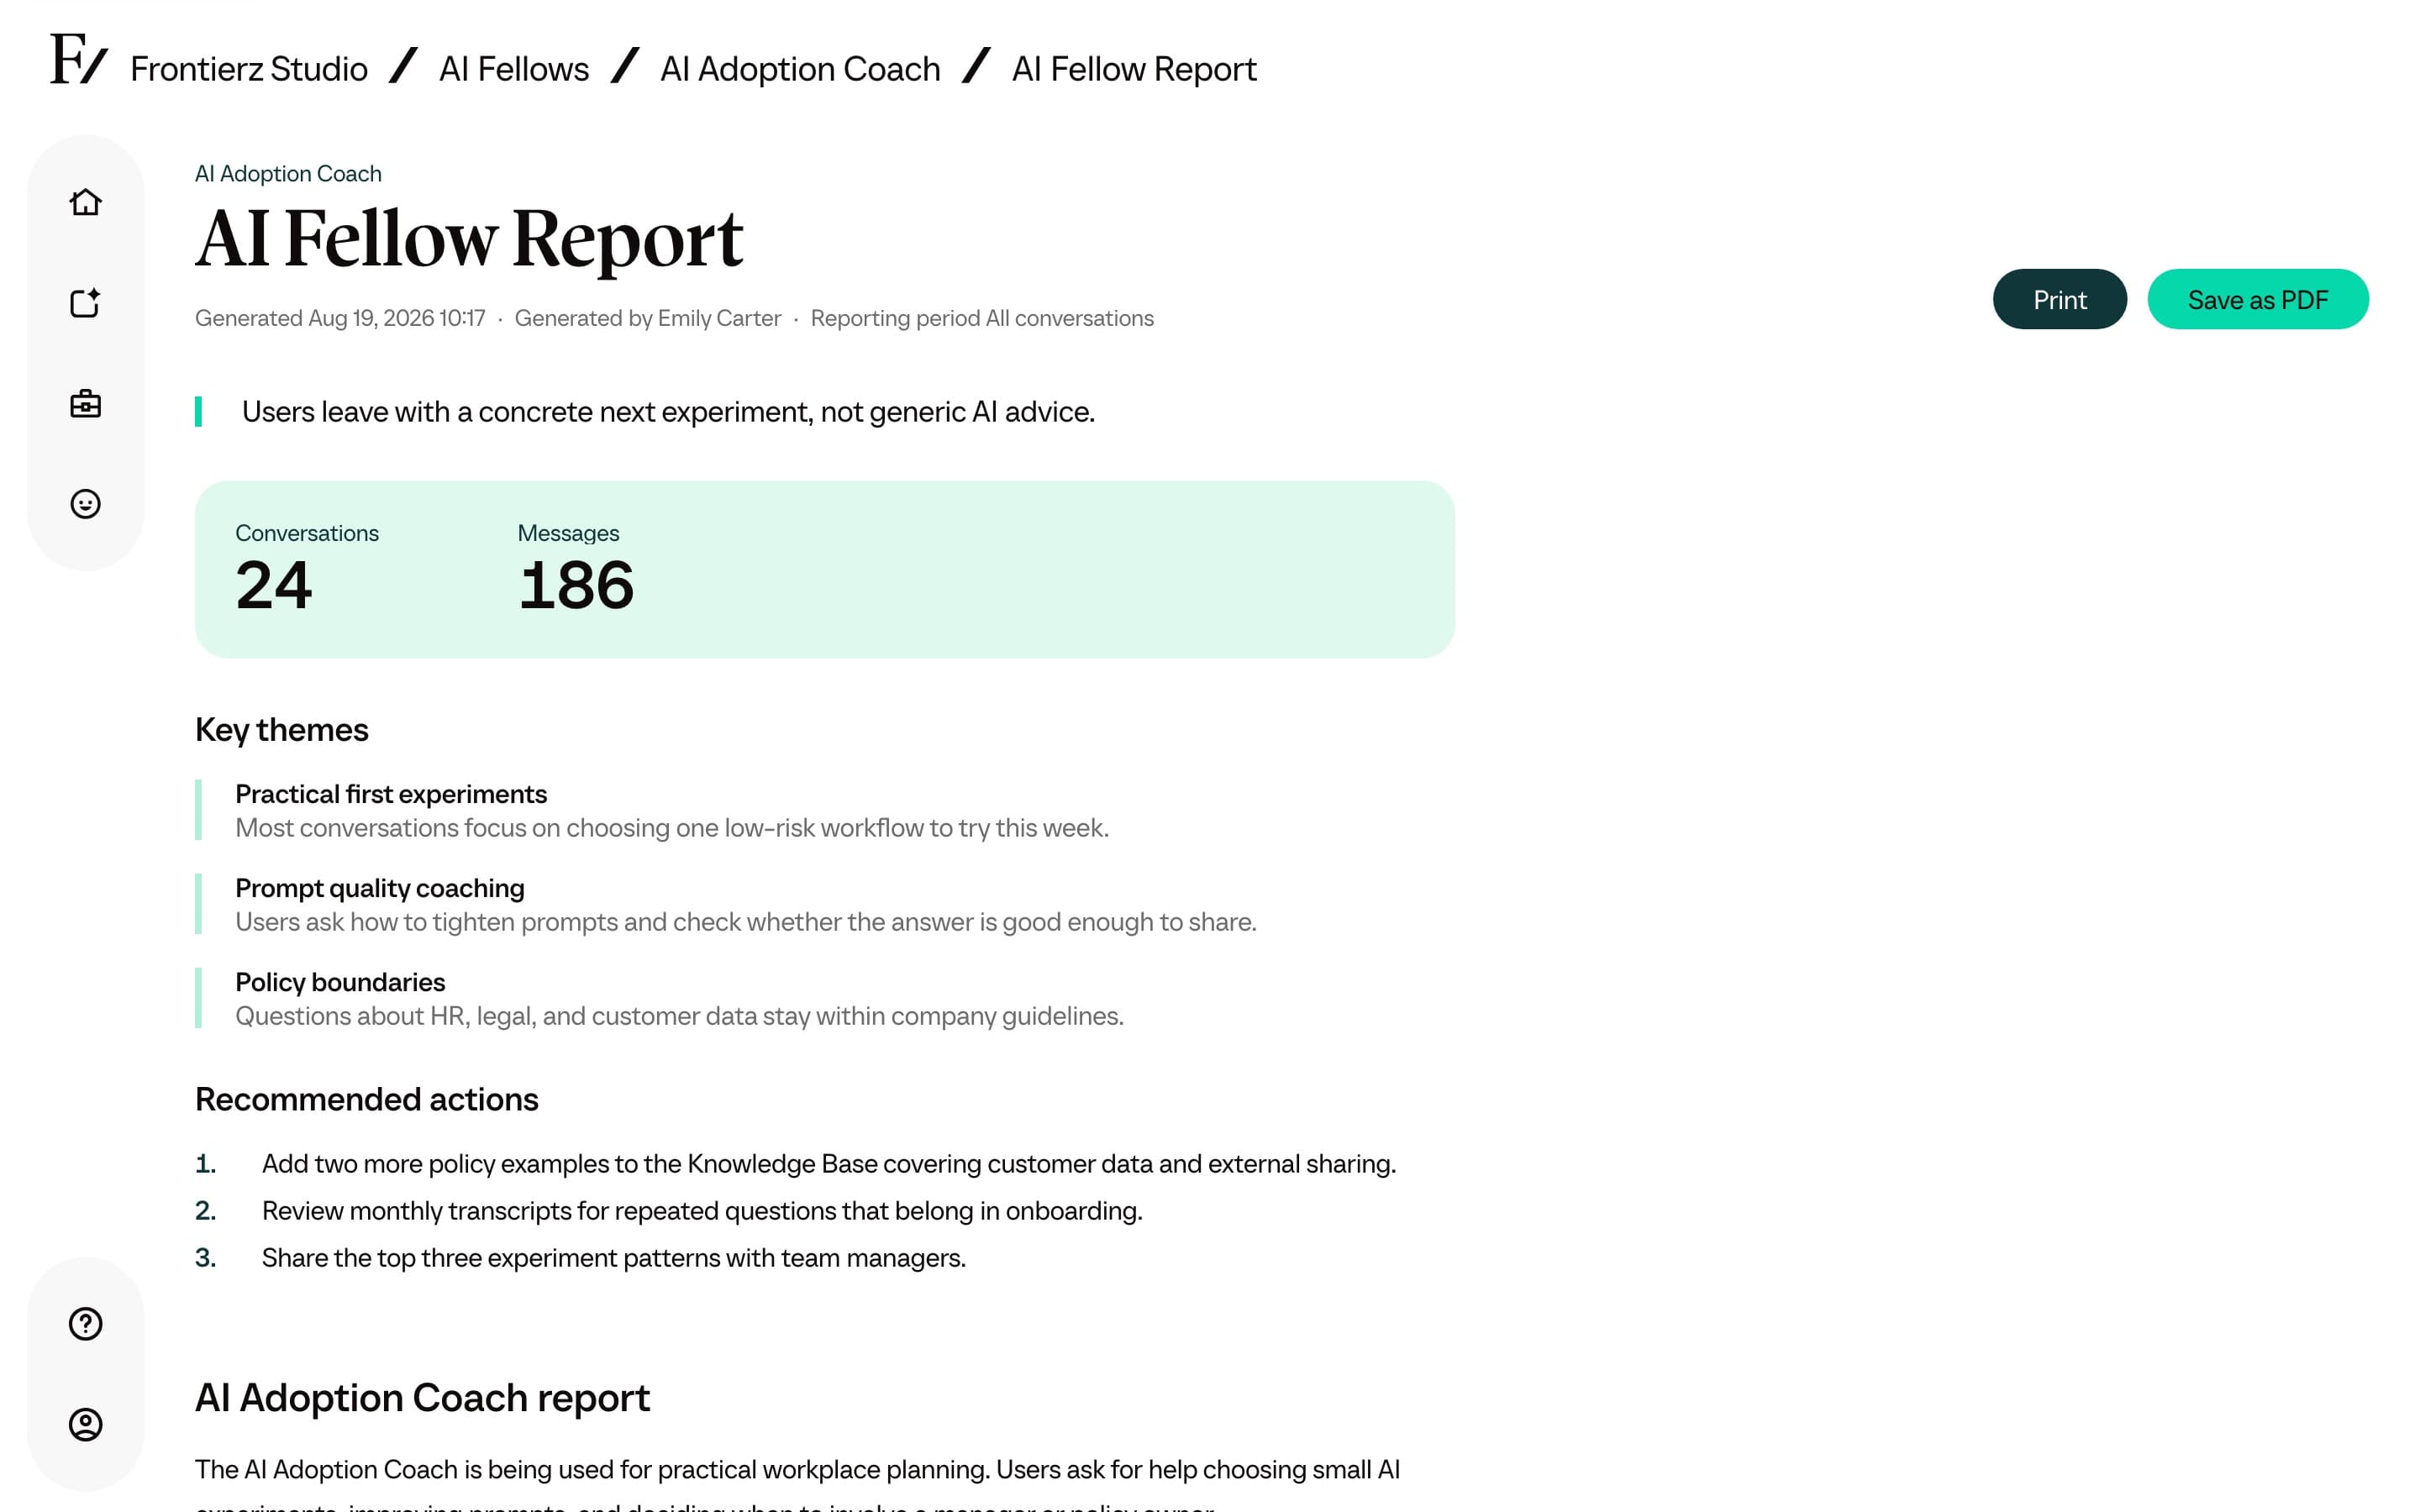
If a previous report already exists, the dashboard shows View last report. Generating again creates an updated report without removing the older completed report.
Export analytics data
Learning Path progress and analytics data is exported from the Manage Users page.
The analytics dashboard does not contain this export control. See Manage Users for the export location.
Actions → Export on the dashboard downloads a Frontierz Learning Path file, not the progress CSV. See Import a Frontierz Learning Path.
Inside a Learning Path, progress is attributed per user. The export follows the same privacy rules described in Privacy and data.