Last updated on
Usage Log
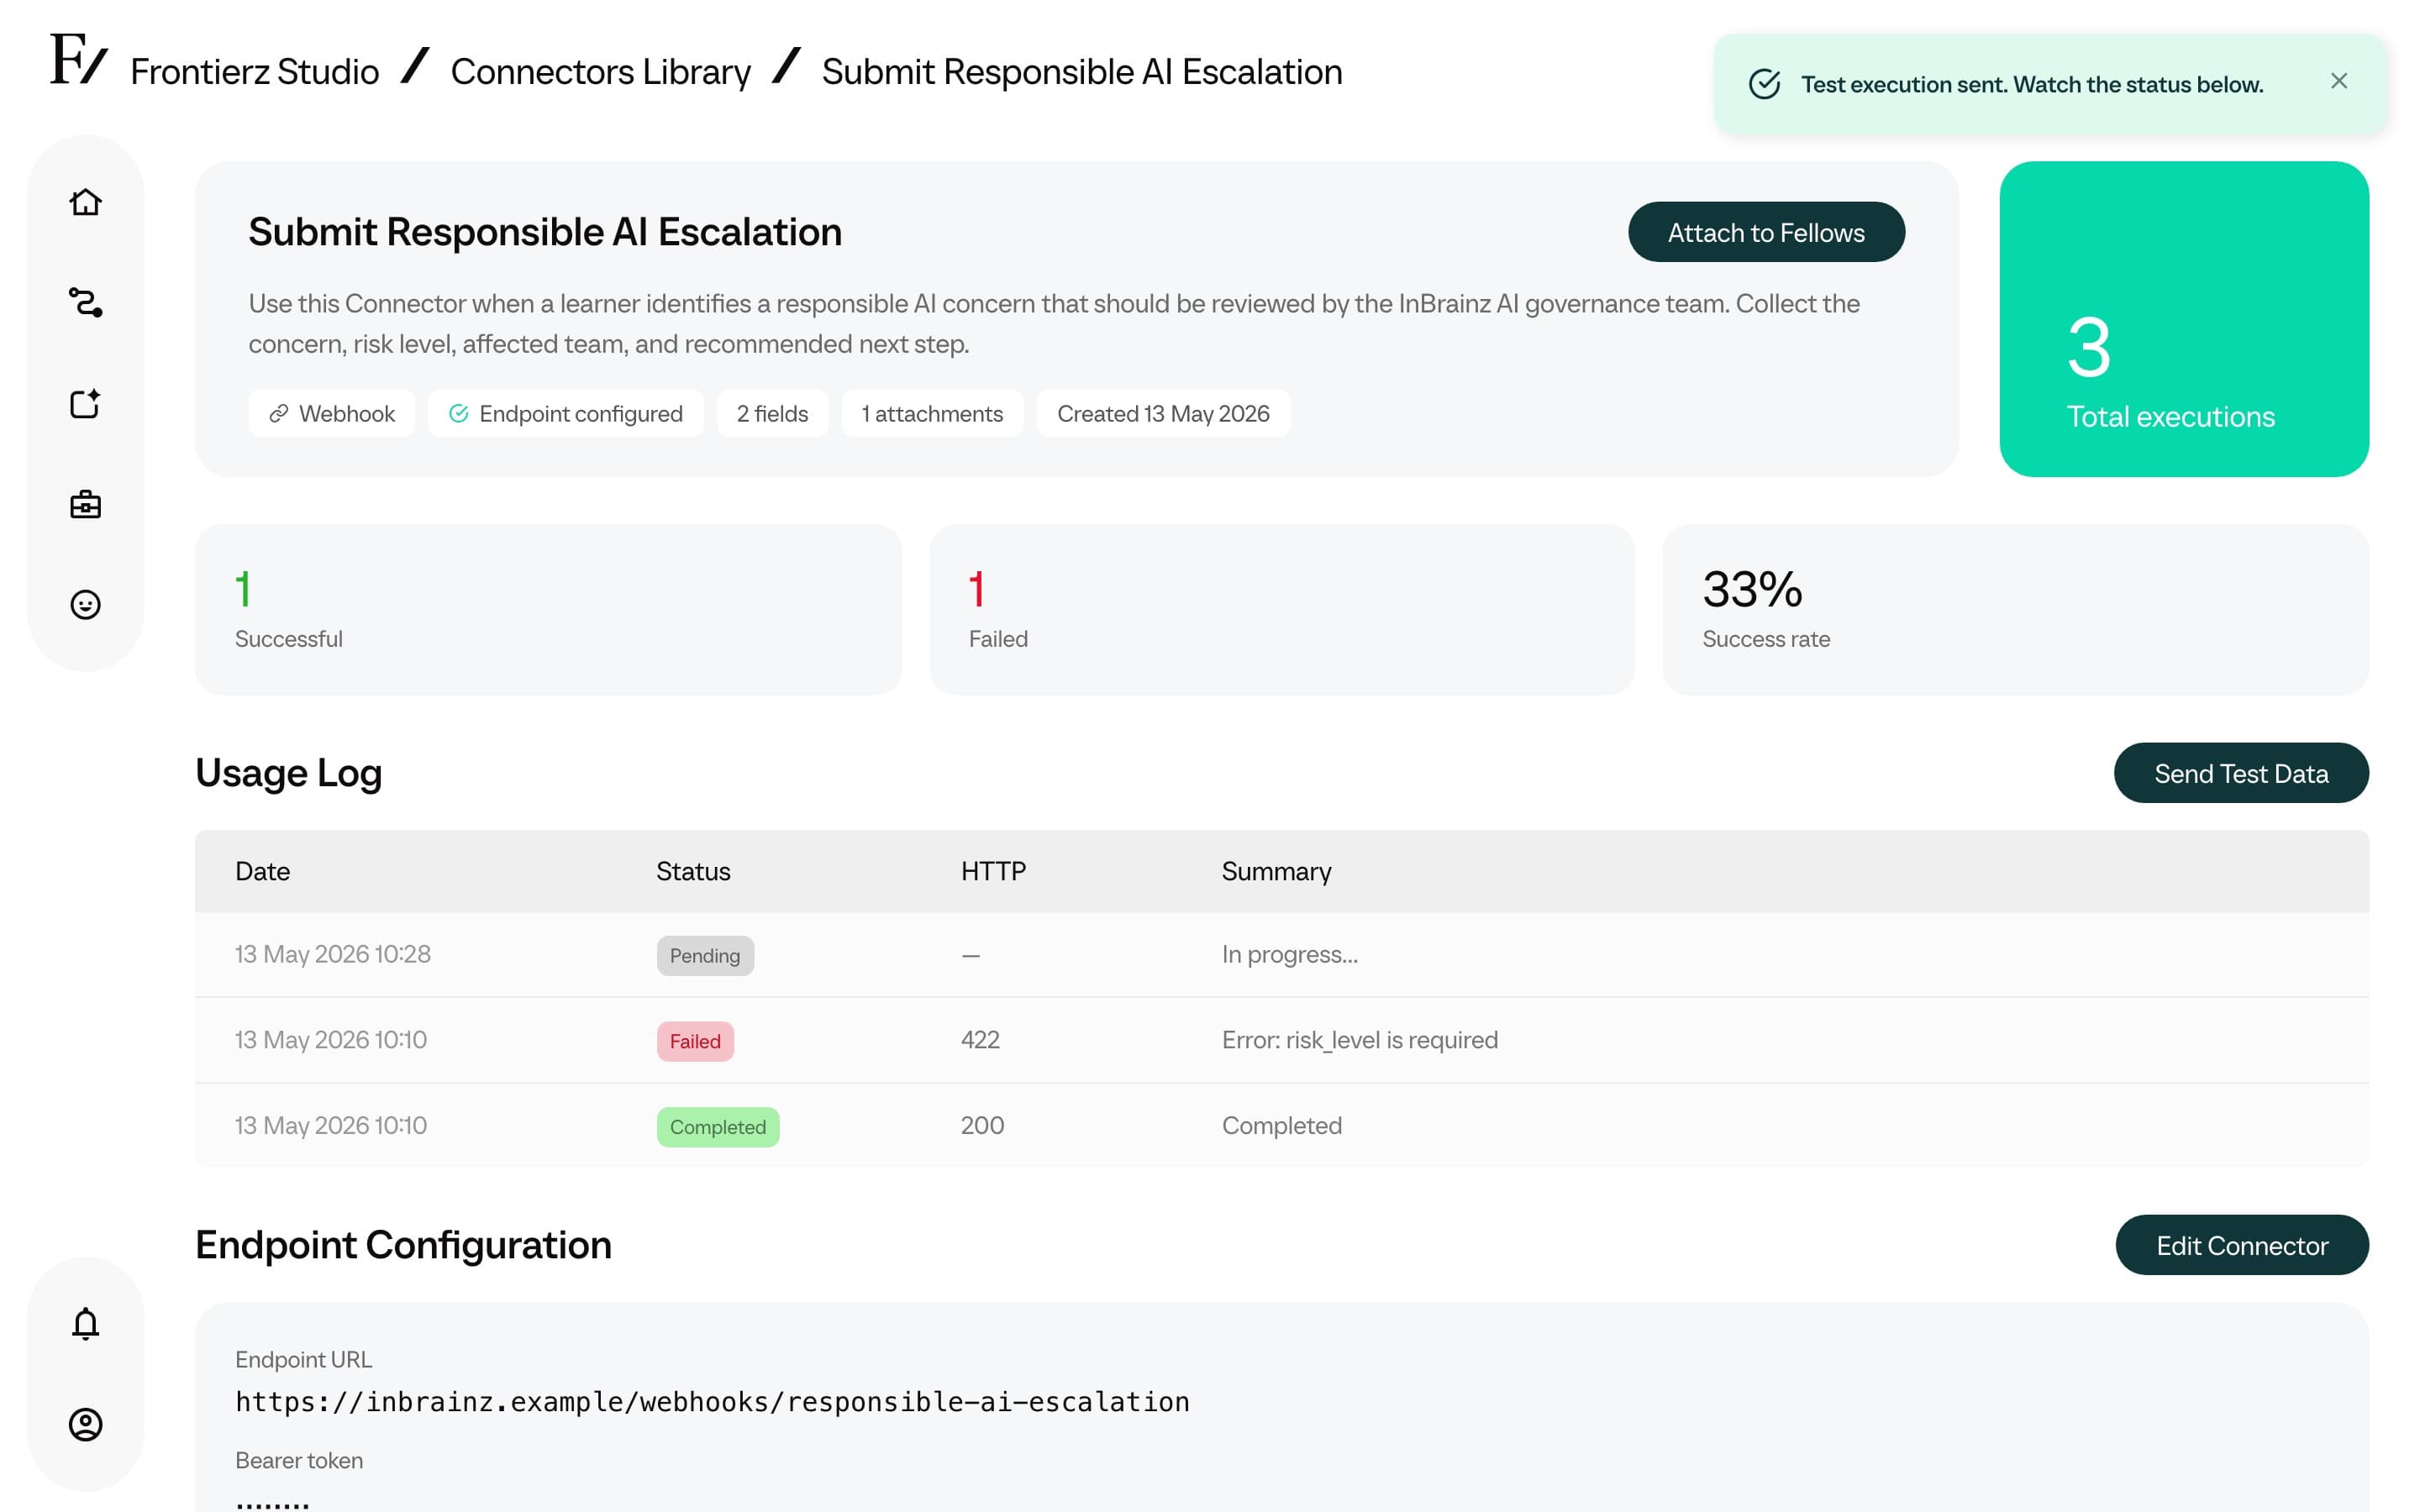
Use the execution log to check whether a Connector ran and what happened. Each entry shows the information sent to the connected system, its response, and whether the request succeeded, failed, or is still pending. This helps administrators and IT teams investigate a reported problem or verify a new integration.
Execution log location
The Connectors Library has two views into executions:
- Company-wide. The Connectors Library index (the main page that opens by default) displays the most recent executions across every Connector in the organization. Useful when the responsible Connector is not yet known.
- For a single Connector. The Connector detail page has its own executions table with totals (succeeded, failed, pending) and a full history.
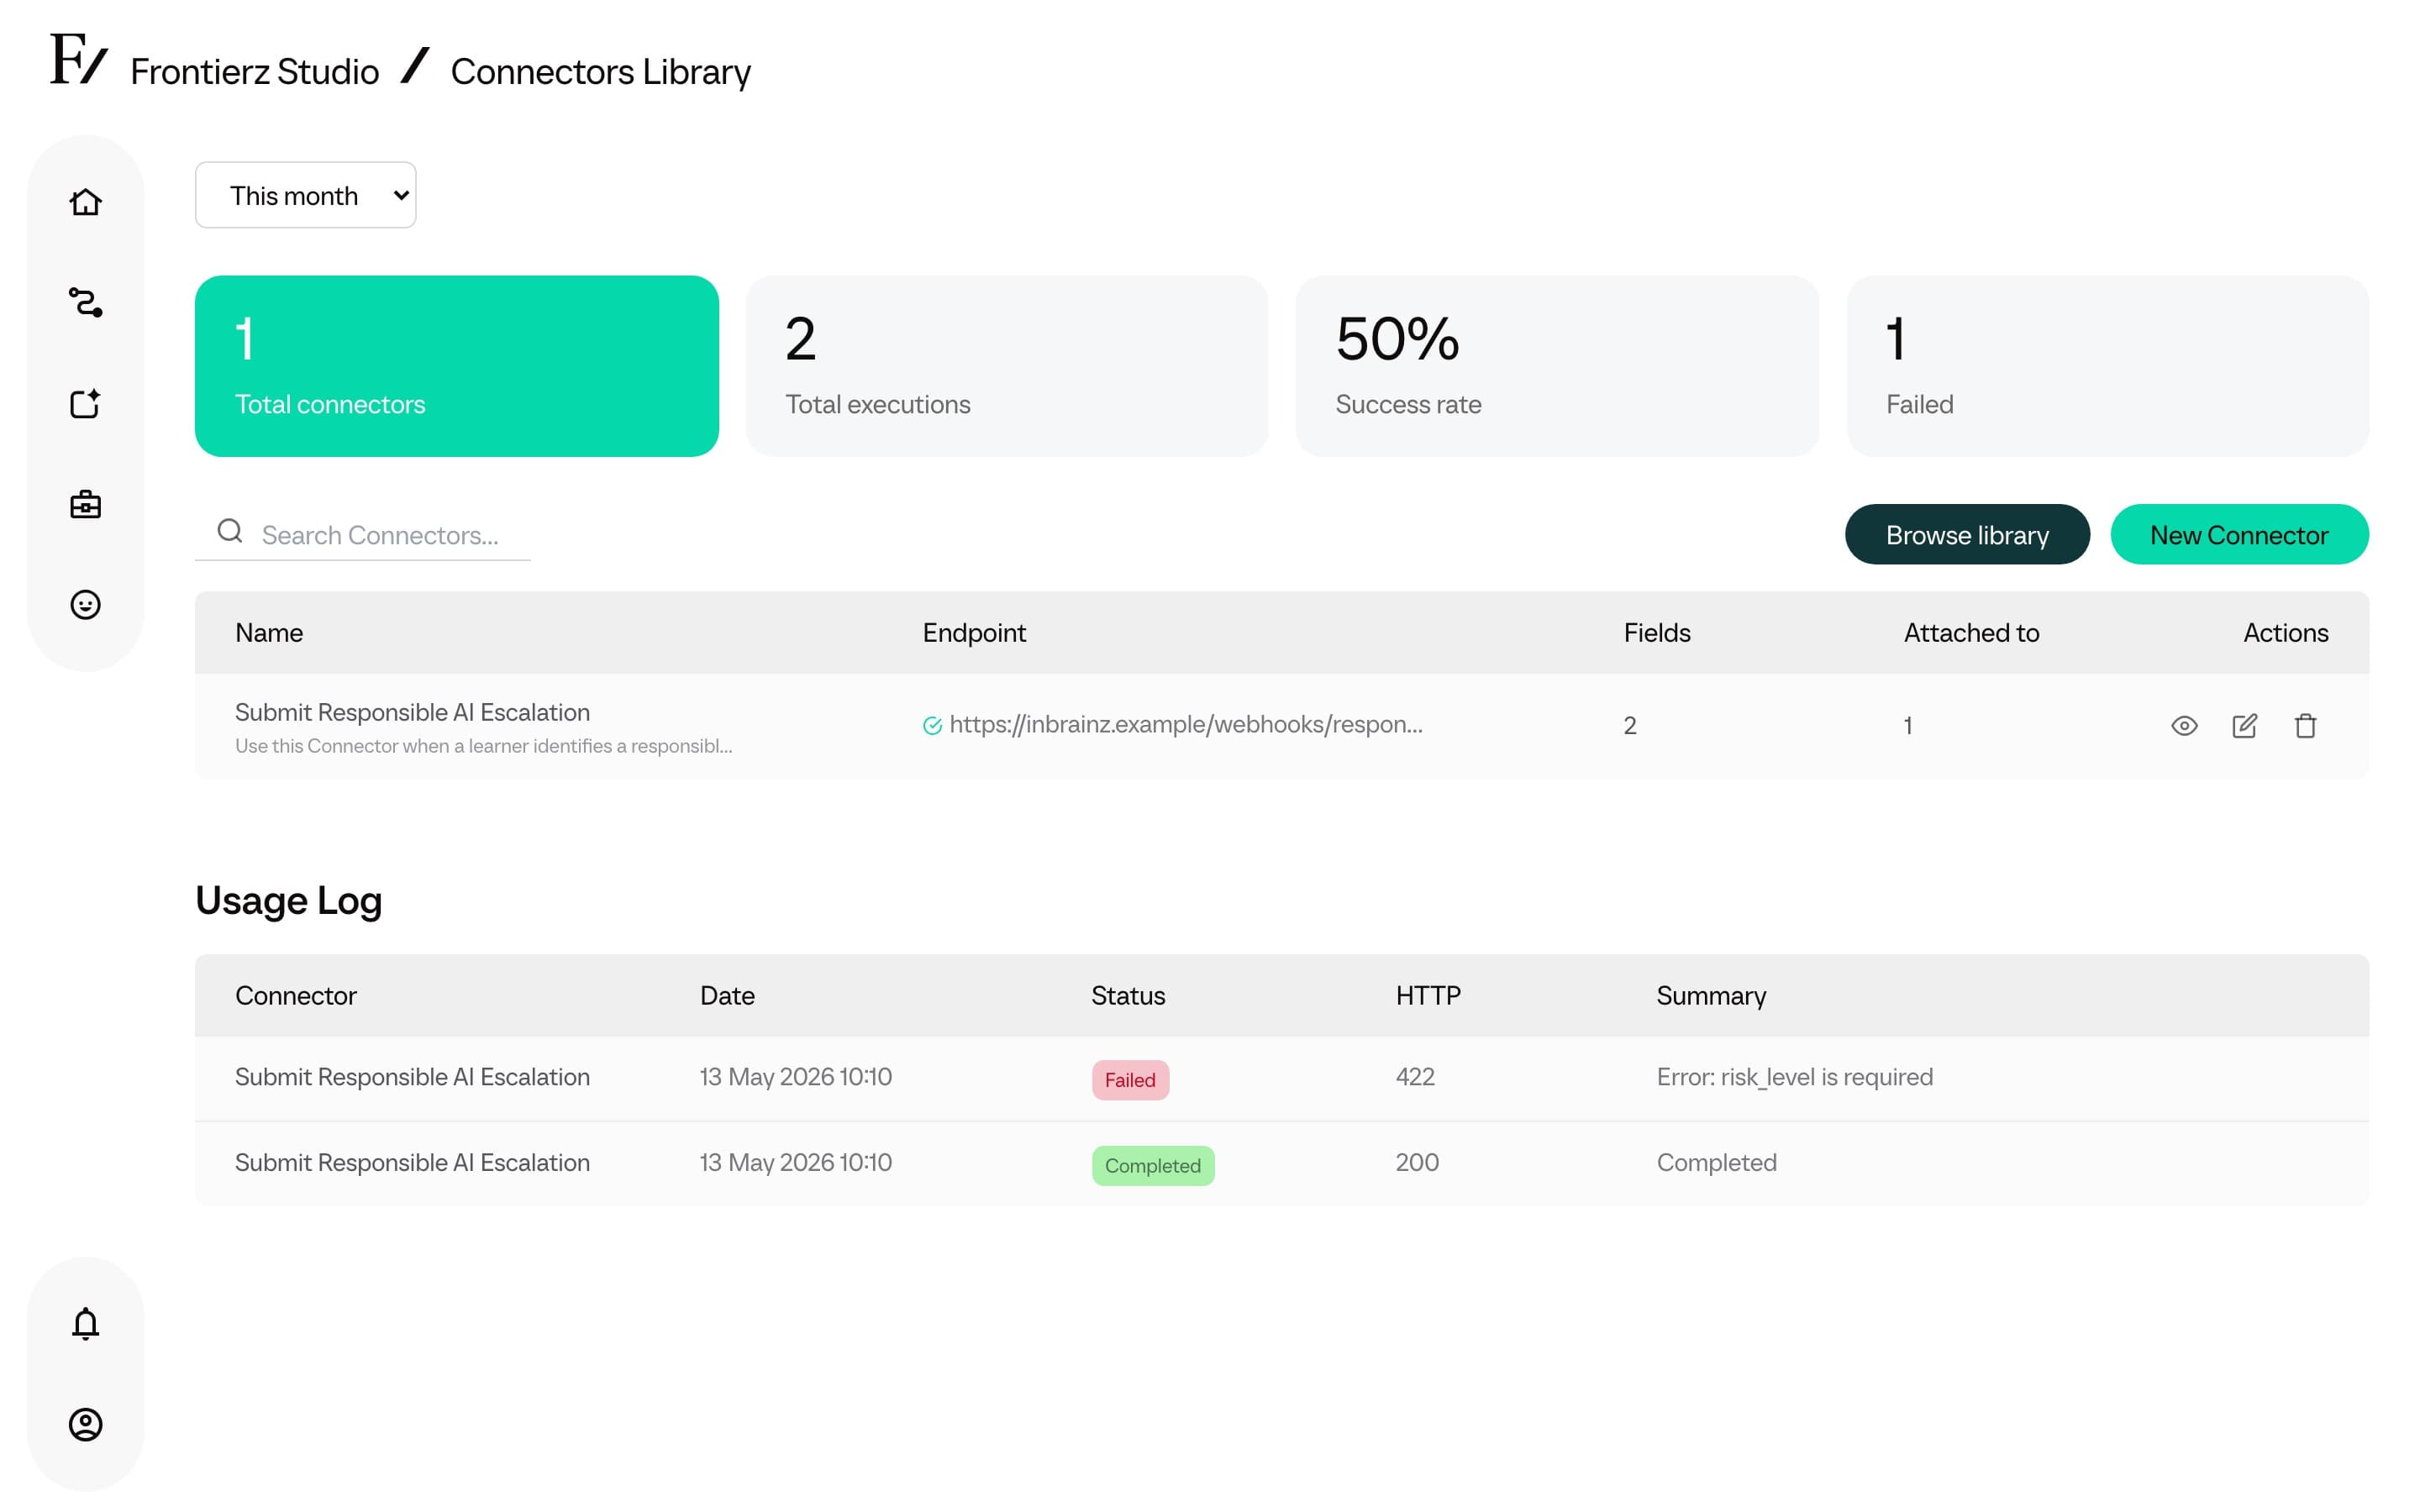
Open the executions for a Connector
Open Frontierz Studio → Connectors.
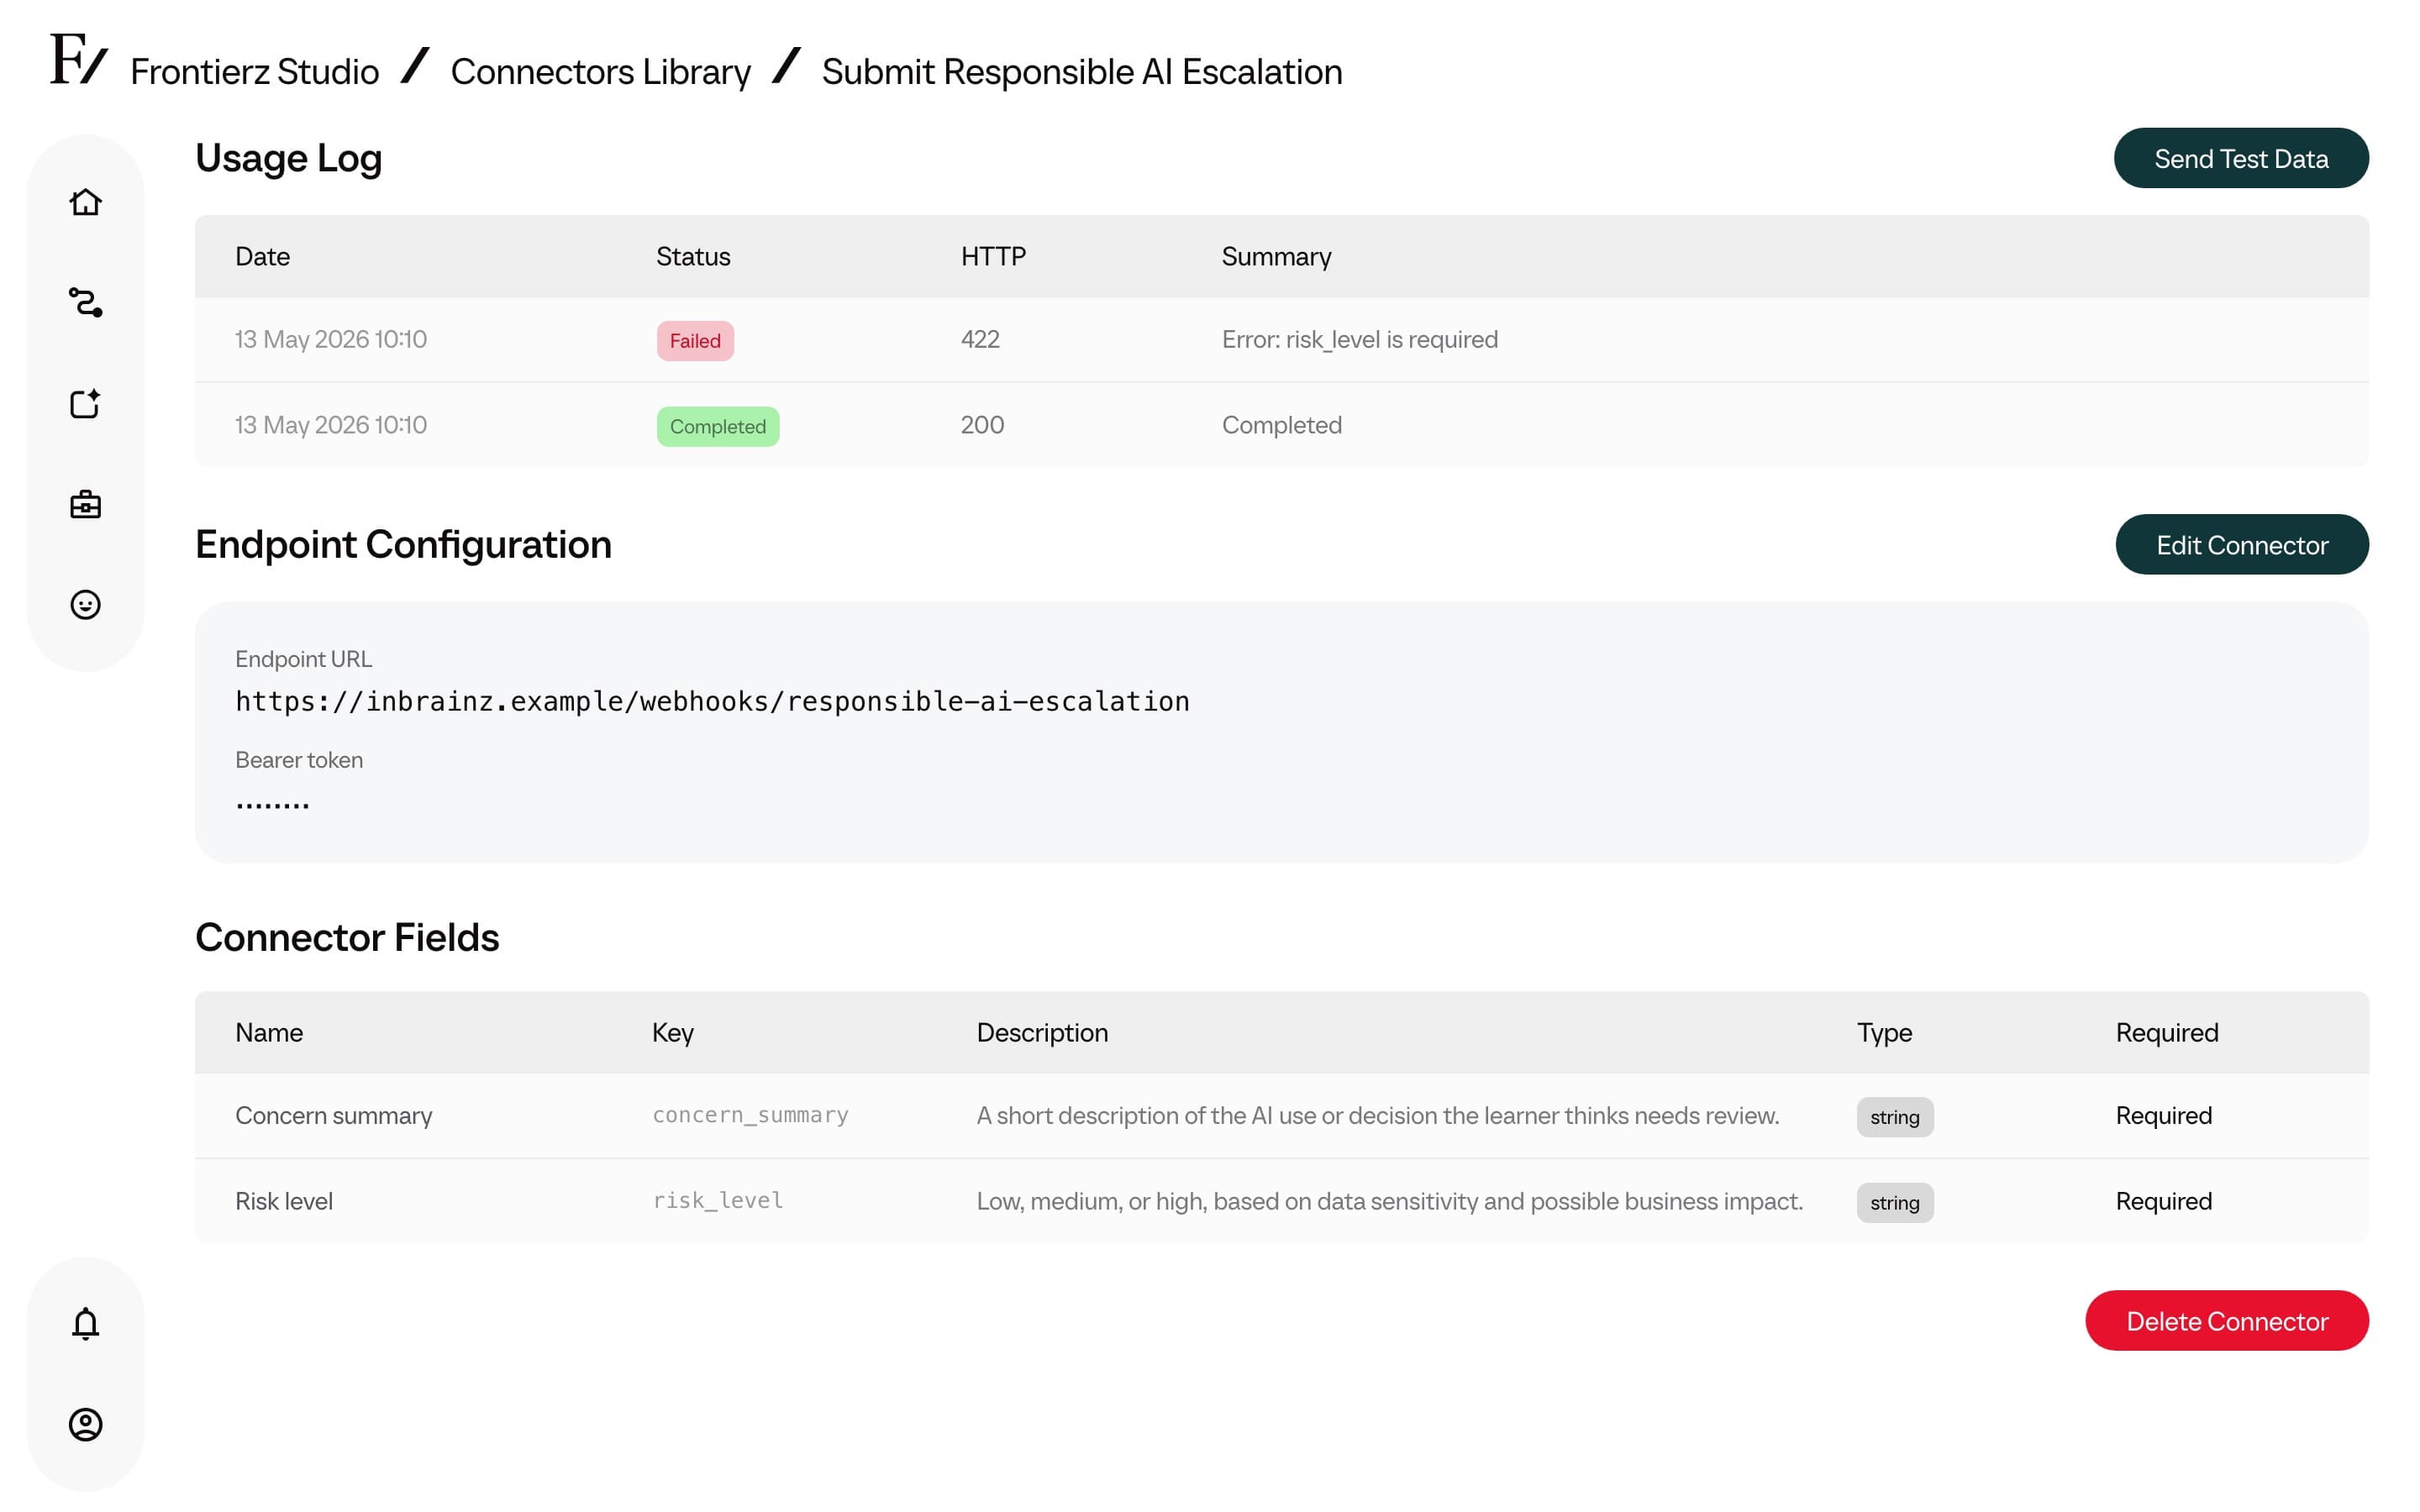
Scroll to the Usage Log section on the detail page. Open a row to see the full request sent to the system and the response it returned.
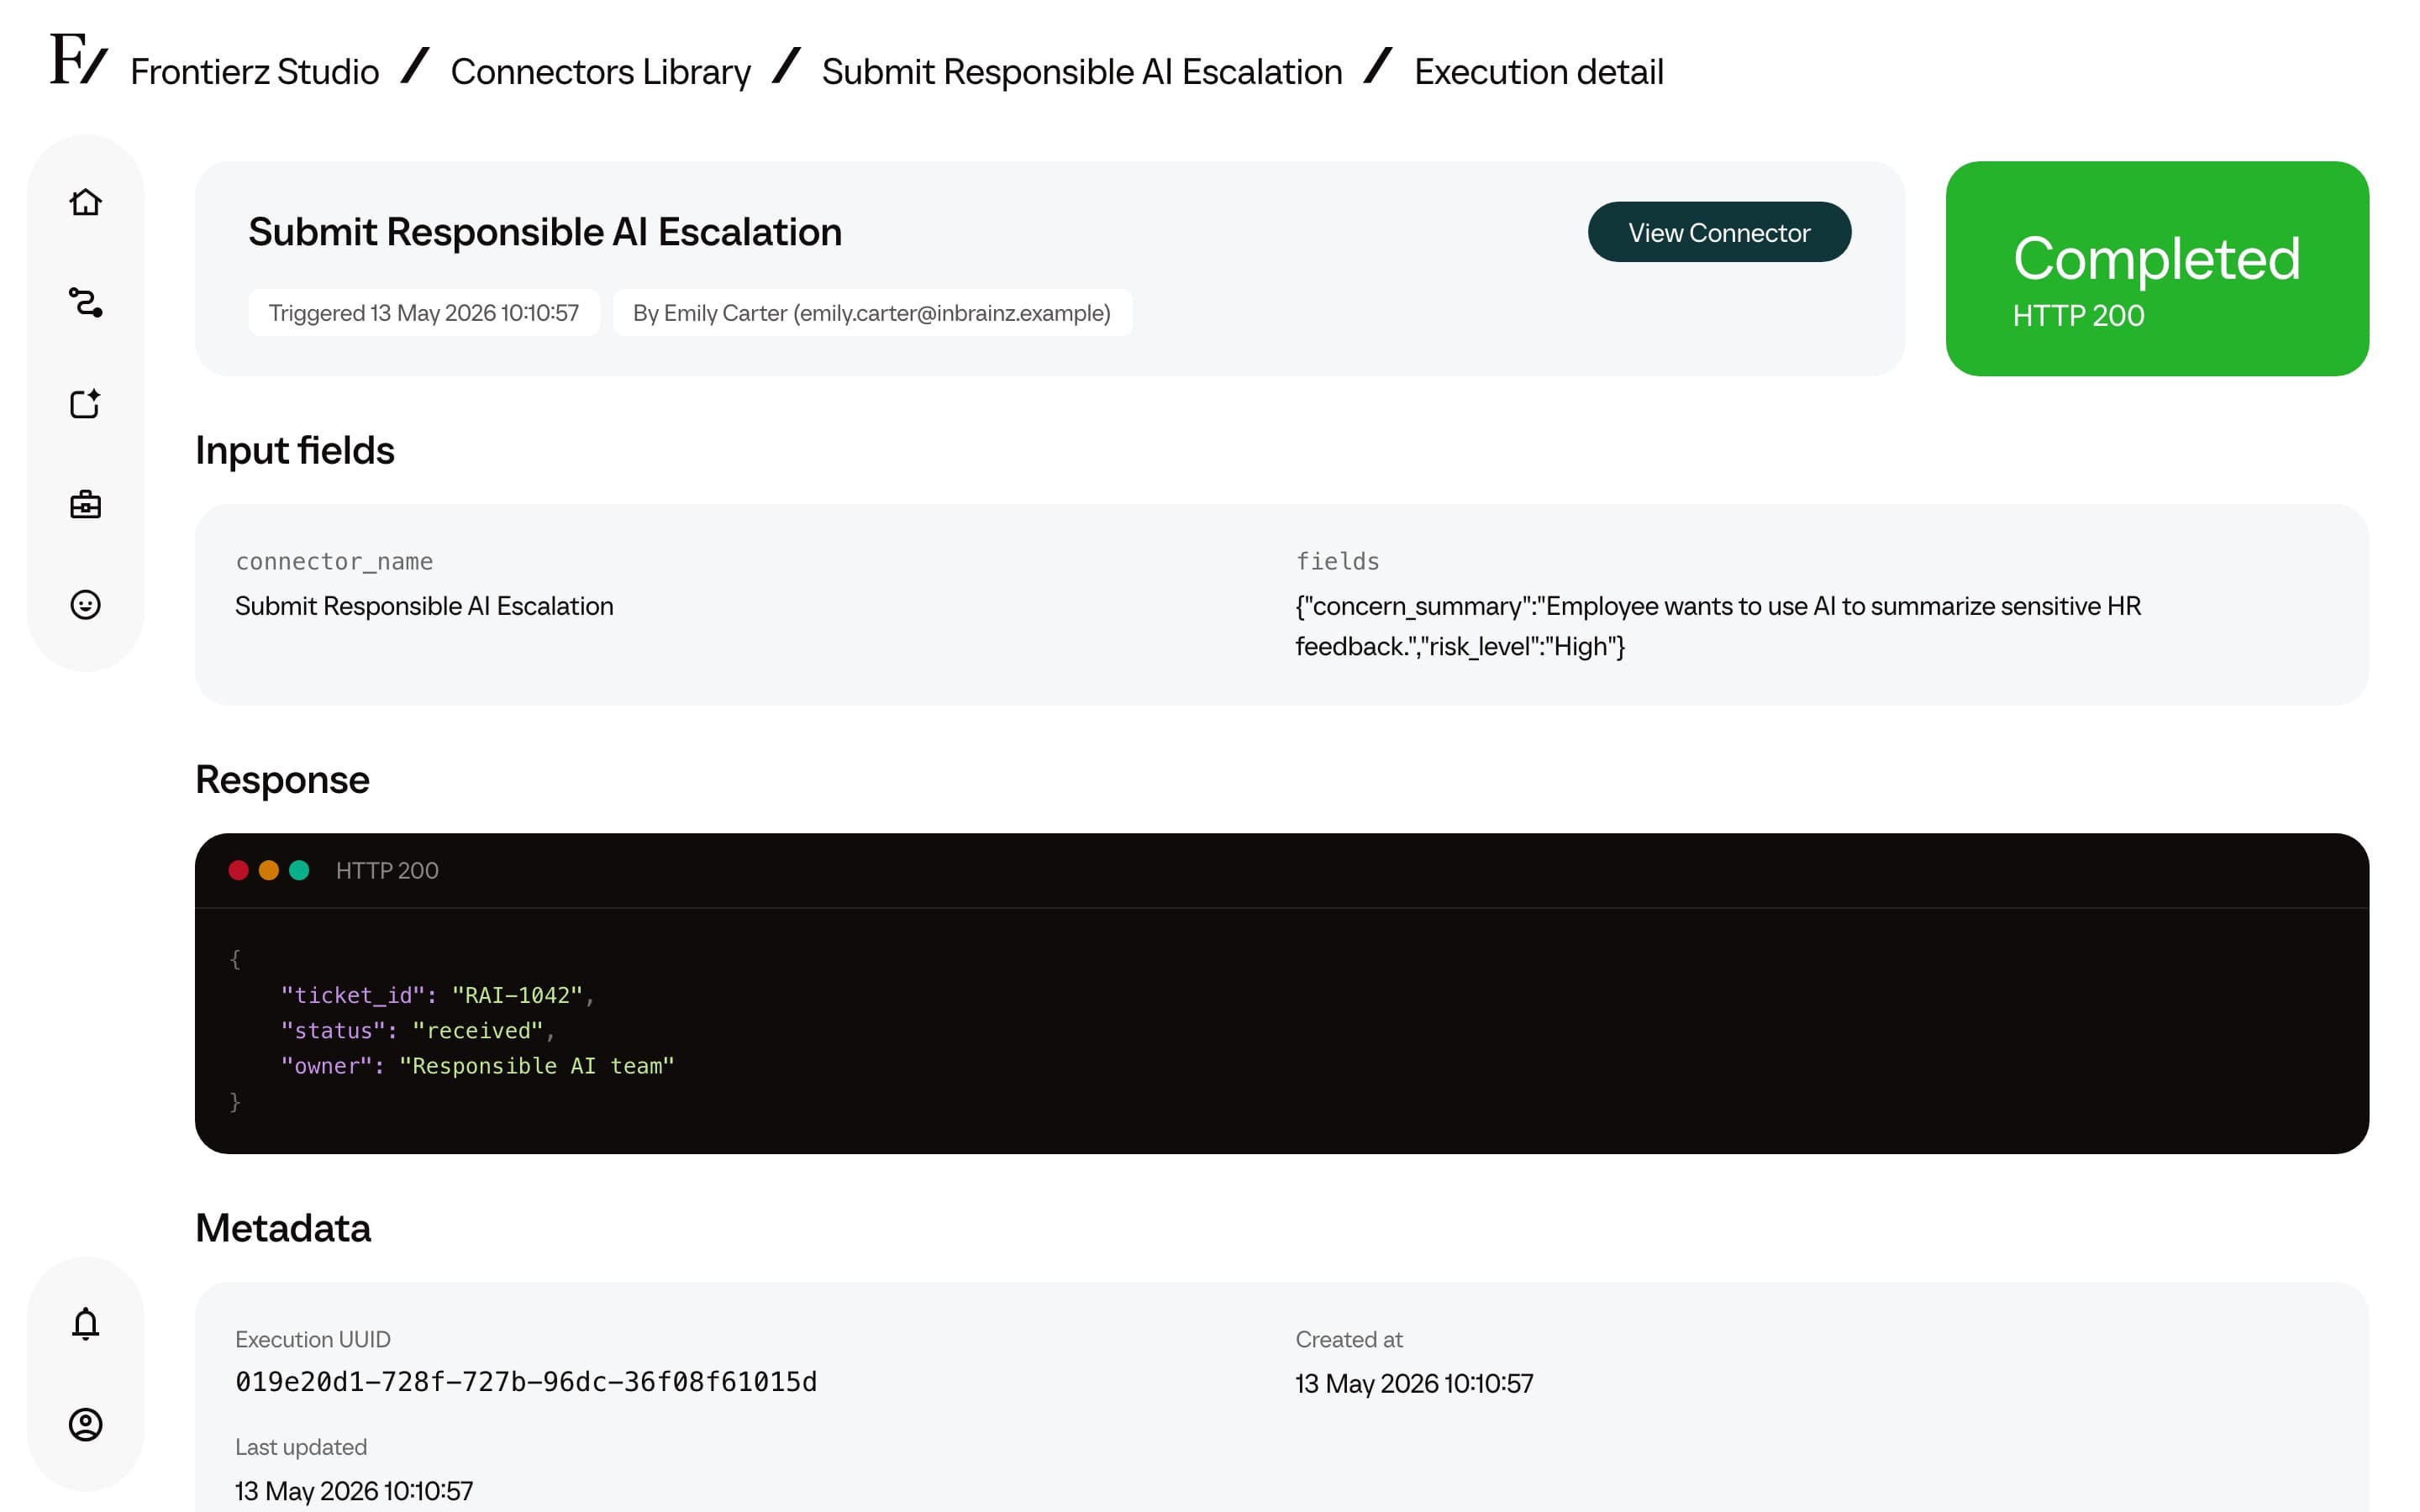
For each call, the following information is shown:
- Timestamp of the invocation.
- Input the AI Fellow gathered from the user and sent in.
- Response received from the integration.
- Status: succeeded, failed, or pending.
The executions view should be consulted when verifying a newly deployed Connector or when investigating reported failures. The log indicates whether the Connector was invoked and, if so, the response returned. A manual test run can also be sent from the same page. See Test the Connector before publication.